

Question: A plant manager would like to analyze the data output* (tables and figures) provided on the production from ten different machines producing bags of M&M
A plant manager would like to analyze the data output* (tables and figures) provided on the production from ten different machines producing bags of M&M candies. The desired production output is for the bags to have nearly equal numbers and weights of each of the six colors of M&Ms and a total bag weight to be no less than 5.30 and not to exceed 6.00.
The manager has asked you to prepare a summary review of the data to see if it suggests the machines are in compliance. This would include observations of specific data points that suggest compliance or non-compliance. The manager has also asked you to suggest some additional data collection and analysis options that would provide additional evidence that all bags produced on all the lines do or do not have reasonably equal numbers of colors and meet the overall weight parameter.
- A brief commentary on stating the rationale for one or two figures selected as the best representation of the data. Include these figures in your summary document.
- A brief review of the statistical analysis, stating the rationale for each table selected to provide the best answer to the managers request. I
- Formal methods and results narratives for the selected analysis (mimic the textbook examples).
- A brief suggestion for future data collection and analysis as noted in the managers request above.
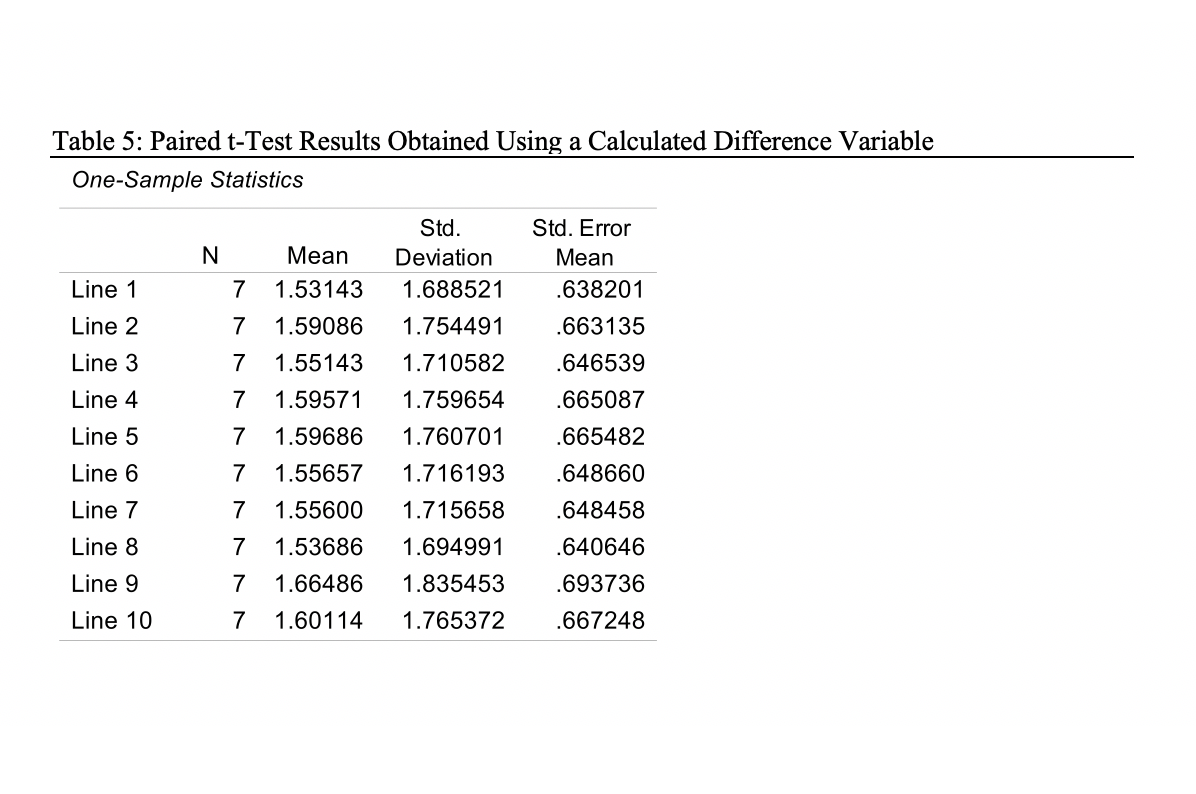
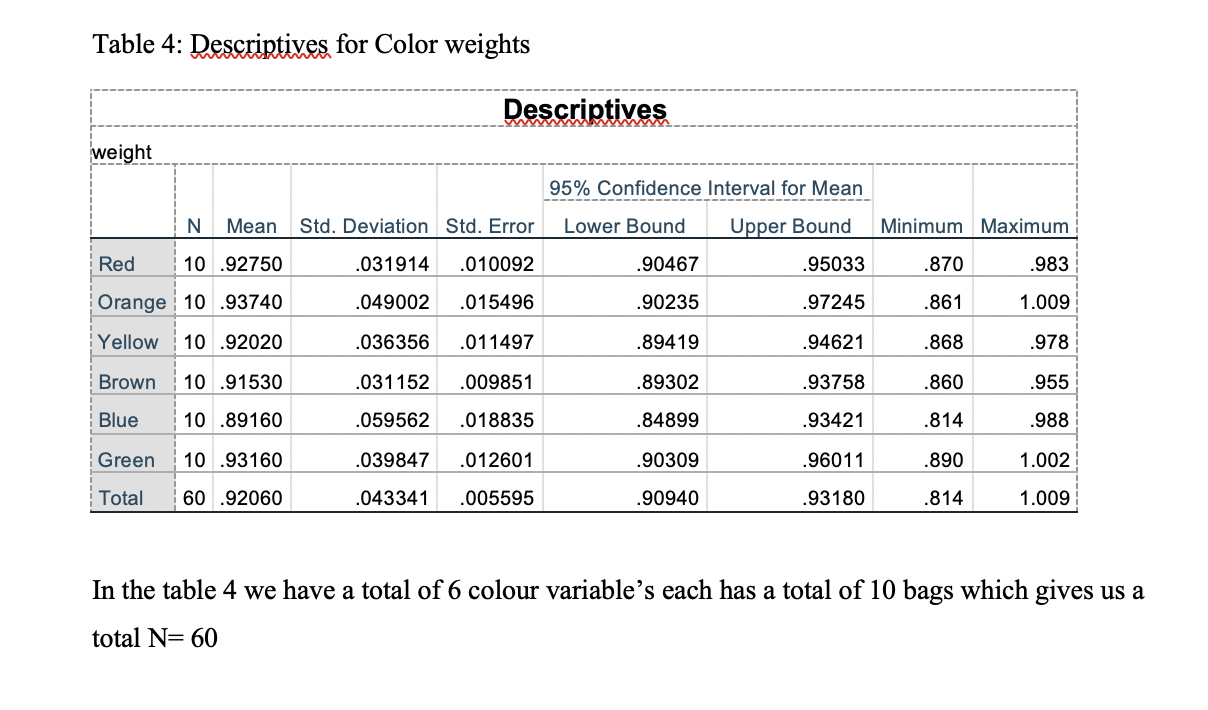
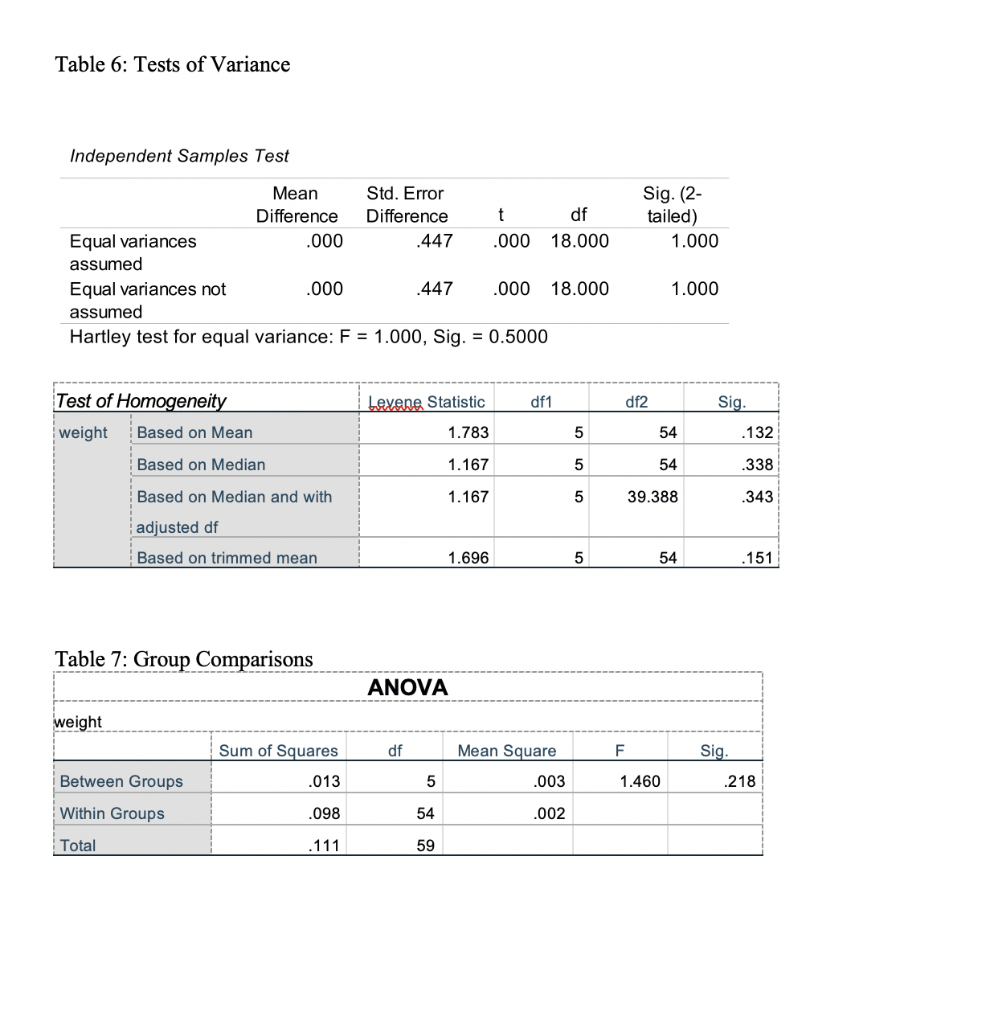
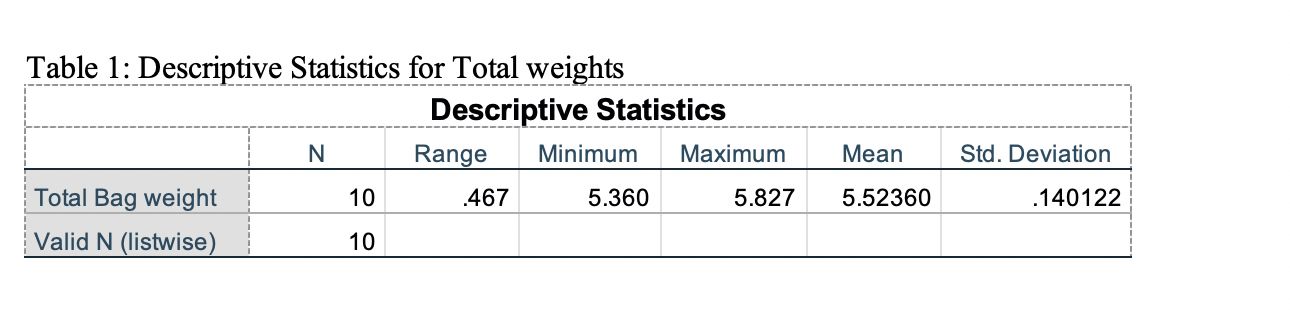
Table 5: Paired t-Test Results Obtained Using a Calculated Difference Variable One-Sample Statistics N Std. Deviation 1.688521 Line 1 Line 2 1.754491 Line 3 1.710582 Line 4 1.759654 Std. Error Mean .638201 .663135 .646539 .665087 .665482 .648660 .648458 .640646 Mean 7 1.53143 7 1.59086 7 1.55143 7 1.59571 7 1.59686 7 1.55657 7 1.55600 7 1.53686 7 1.66486 7 1.60114 Line 5 Line 6 Line 7 Line 8 1.760701 1.716193 1.715658 1.694991 1.835453 1.765372 Line 9 .693736 Line 10 .667248 Table 4: Descriptives for Color weights Descriptives weight 95% Confidence Interval for Mean N Mean Std. Deviation Std. Error Lower Bound Upper Bound Minimum Maximum Red 10 .92750 .031914 .010092 .90467 .95033 .870 .983 Orange 10 .93740 .049002 .015496 .90235 .97245 .861 1.009 Yellow 10 .92020 .036356 .011497 .89419 .94621 .868 .978 Brown 10 .91530 .031152 .009851 89302 .93758 .860 .955 Blue 10 .89160 .059562 .018835 .84899 .93421 .814 .988 Green 10 .93160 .039847 .012601 .90309 .96011 .890 1.002 Total 60 .92060 .043341 .005595 .90940 .93180 .814 1.009 In the table 4 we have a total of 6 colour variables each has a total of 10 bags which gives us a total N= 60 Table 6: Tests of Variance Independent Samples Test t Sig. (2- tailed) 1.000 Mean Std. Error Difference Difference df Equal variances .000 447 .000 18.000 assumed Equal variances not .000 447 .000 18.000 assumed Hartley test for equal variance: F = 1.000, Sig. = 0.5000 1.000 Lexene Statistic df1 df2 Sig. Test of Homogeneity weight Based on Mean Based on Median 1.783 5 54 .132 1.167 5 54 .338 Based on Median and with 1.167 5 39.388 .343 adjusted df Based on trimmed mean 1.696 5 54 .151 Table 7: Group Comparisons ANOVA weight df Mean Square F Sig. Sum of Squares .013 Between Groups 5 .003 1.460 .218 Within Groups .098 54 .002 Total .111 59 Table 1: Descriptive Statistics for Total weights Descriptive Statistics N Range Minimum Maximum Total Bag weight 10 467 5.360 5.827 Valid N (listwise) 10 Mean Std. Deviation 5.52360 .140122 Table 5: Paired t-Test Results Obtained Using a Calculated Difference Variable One-Sample Statistics N Std. Deviation 1.688521 Line 1 Line 2 1.754491 Line 3 1.710582 Line 4 1.759654 Std. Error Mean .638201 .663135 .646539 .665087 .665482 .648660 .648458 .640646 Mean 7 1.53143 7 1.59086 7 1.55143 7 1.59571 7 1.59686 7 1.55657 7 1.55600 7 1.53686 7 1.66486 7 1.60114 Line 5 Line 6 Line 7 Line 8 1.760701 1.716193 1.715658 1.694991 1.835453 1.765372 Line 9 .693736 Line 10 .667248 Table 4: Descriptives for Color weights Descriptives weight 95% Confidence Interval for Mean N Mean Std. Deviation Std. Error Lower Bound Upper Bound Minimum Maximum Red 10 .92750 .031914 .010092 .90467 .95033 .870 .983 Orange 10 .93740 .049002 .015496 .90235 .97245 .861 1.009 Yellow 10 .92020 .036356 .011497 .89419 .94621 .868 .978 Brown 10 .91530 .031152 .009851 89302 .93758 .860 .955 Blue 10 .89160 .059562 .018835 .84899 .93421 .814 .988 Green 10 .93160 .039847 .012601 .90309 .96011 .890 1.002 Total 60 .92060 .043341 .005595 .90940 .93180 .814 1.009 In the table 4 we have a total of 6 colour variables each has a total of 10 bags which gives us a total N= 60 Table 6: Tests of Variance Independent Samples Test t Sig. (2- tailed) 1.000 Mean Std. Error Difference Difference df Equal variances .000 447 .000 18.000 assumed Equal variances not .000 447 .000 18.000 assumed Hartley test for equal variance: F = 1.000, Sig. = 0.5000 1.000 Lexene Statistic df1 df2 Sig. Test of Homogeneity weight Based on Mean Based on Median 1.783 5 54 .132 1.167 5 54 .338 Based on Median and with 1.167 5 39.388 .343 adjusted df Based on trimmed mean 1.696 5 54 .151 Table 7: Group Comparisons ANOVA weight df Mean Square F Sig. Sum of Squares .013 Between Groups 5 .003 1.460 .218 Within Groups .098 54 .002 Total .111 59 Table 1: Descriptive Statistics for Total weights Descriptive Statistics N Range Minimum Maximum Total Bag weight 10 467 5.360 5.827 Valid N (listwise) 10 Mean Std. Deviation 5.52360 .140122
Step by Step Solution
There are 3 Steps involved in it

Get step-by-step solutions from verified subject matter experts