

Question: Data Analytics Plot: A plant manager would like to analyze the production from ten different machines producing bags of M&M candies. The stated desired output
Data Analytics
Plot:
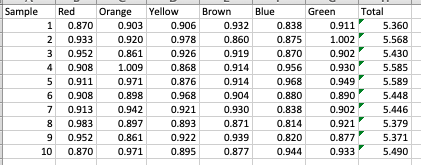
A plant manager would like to analyze the production from ten different machines producing bags of M&M candies. The stated desired output is for the bags to have nearly equal weights of each of the six colors of M&Ms and the total bag weight to be no less than 5.30 and not to exceed 6.00.He has asked me to prepare quick initial reviews of the data that will help to determine if the machines are in compliance and some thoughts about additional analysis.
Completed the following:
Import the Excel data setM&M line productioninto SPSS
Review the imported data and adjust the data variables if needed. Save the file with in SPSS with the sav extension.
Need Help
Considering three descriptive data output options (bar charts, histogram, frequency table, etc.) run one of the three.
Considering three possible statistical analysis output options T-Tests, ANOVA, Regression, etc.) run one of the three.
After I understand how to run/select these test I should be able to complete the questions/requirements below:
- A brief review of the descriptive statistics options considered, stating the rational for one chosen and the output from SPSS.
- A brief review of the statistical analysis methods considered, stating the rational for one chosen and the analysis output from SPSS.
- A brief methods narrative (the chosen descriptive and analysis) and brief narrative results section (the data from the output).
- A brief suggestion for future data analysis.
\f
Step by Step Solution
There are 3 Steps involved in it

Get step-by-step solutions from verified subject matter experts