

Question: A) Please help me in interpreting the below results based on the provided method and my hypothesis. B) Please show me around 4 graphs/ figures
A) Please help me in interpreting the below results based on the provided method and my hypothesis.
B) Please show me around 4 graphs/ figures to best represent the below results in relation to my hypothesised interest and the results.
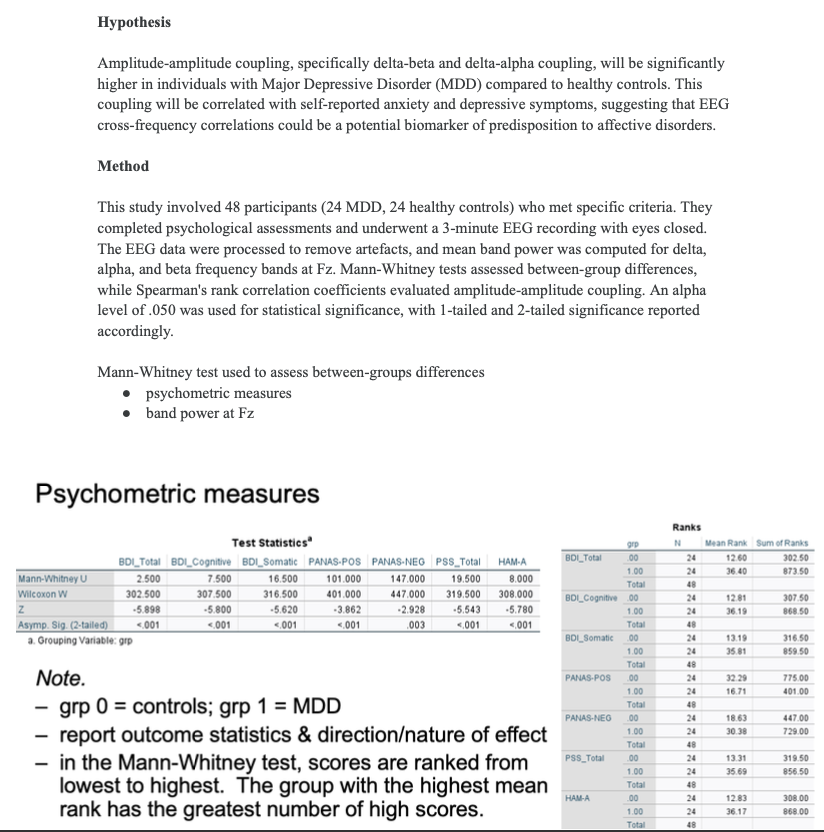
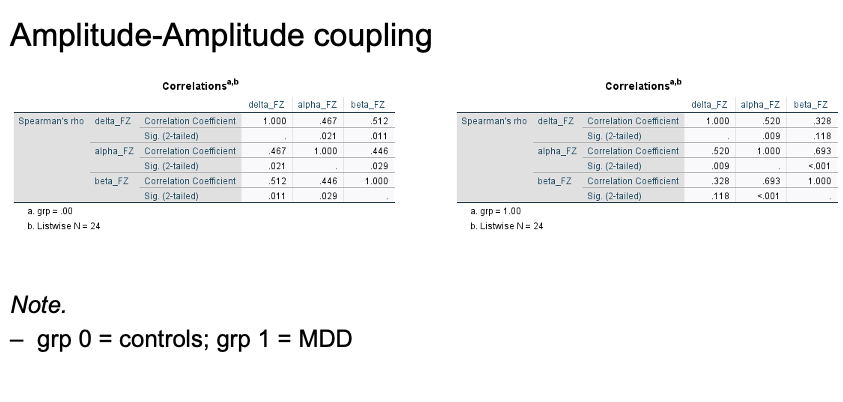
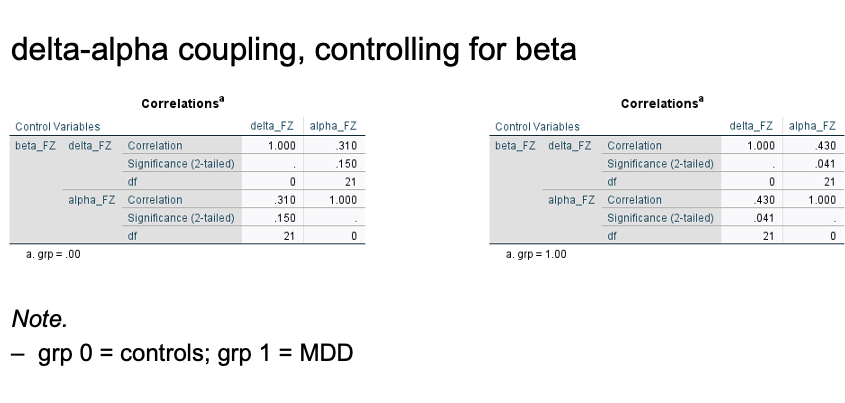
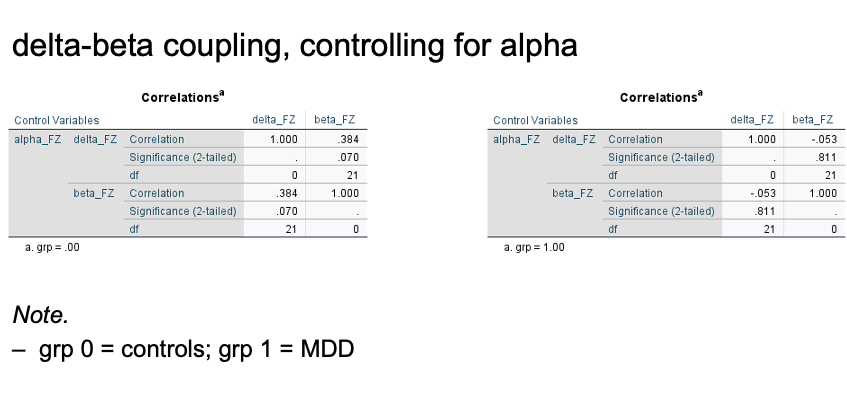
Hypothesis Amplitude-amplitude coupling, specifically delta-beta and delta-alpha coupling, will be significantly higher in individuals with Major Depressive Disorder (MDD) compared to healthy controls. This coupling will be correlated with self-reported anxiety and depressive symptoms, suggesting that EEG cross-frequency correlations could be a potential biomarker of predisposition to affective disorders. Method This study involved 48 participants (24 MDD, 24 healthy controls) who met specific criteria. They completed psychological assessments and underwent a 3-minute EEG recording with eyes closed. The EEG data were processed to remove artefacts, and mean band power was computed for delta, alpha, and beta frequency bands at Fz. Mann-Whitney tests assessed between-group differences, while Spearman's rank correlation coefficients evaluated amplitude-amplitude coupling. An alpha level of .050 was used for statistical significance, with 1-tailed and 2-tailed significance reported accordingly. Mann-Whitney test used to assess between-groups differences psychometric measures band power at Fz Psychometric measures Ranks Test Statistics" gre N Mean Rank Sum of Ranks BDI_Total BDI_Cognitive BDI_Somatic PANAS-POS PANAS-NEG PSS_Total HAM-A BOL Total 24 12 40 302 50 1.00 24 36.40 873.50 Mann-Whitney U 2.500 7.500 16.500 101.000 47.000 19.500 8.000 Total 48 Wilcoxon W 302 500 307.500 316.500 401.000 447.000 319.500 308.000 BOLCognitive 00 24 12:81 307.50 -5.898 -5.800 -5.620 -3.862 -2.928 -5.543 -5.780 1.00 24 36.19 868.50 Asymp. Sig. (2-tailed) <.001 .003 total a. grouping variable: grp bolsomatic note. panas.pos controls mdd panas-neg report outcome statistics direction of effect in the mann-whitney test scores are ranked from pss_total .00 lowest to highest. group with highest mean ham-a rank has greatest number high scores. coupling correlations delta_fz alpha_fz beta_fz spearman rho correlation coefficient sig. .021 .011 .11b .467 .512 .328 b. listwise n="24" mdddelta-alpha controlling for beta control variables .310 significance df mdddelta-beta alpha dif di>
Step by Step Solution
There are 3 Steps involved in it

Get step-by-step solutions from verified subject matter experts