

Question: A) Please help me in interpreting the below results based on the provided method and my hypothesis. B) What is the best way to represent
A) Please help me in interpreting the below results based on the provided method and my hypothesis.
- B) What is the best way to represent the below results in 2 - 4 graphs and/ or figures to most accurately show my hypothesised interest?
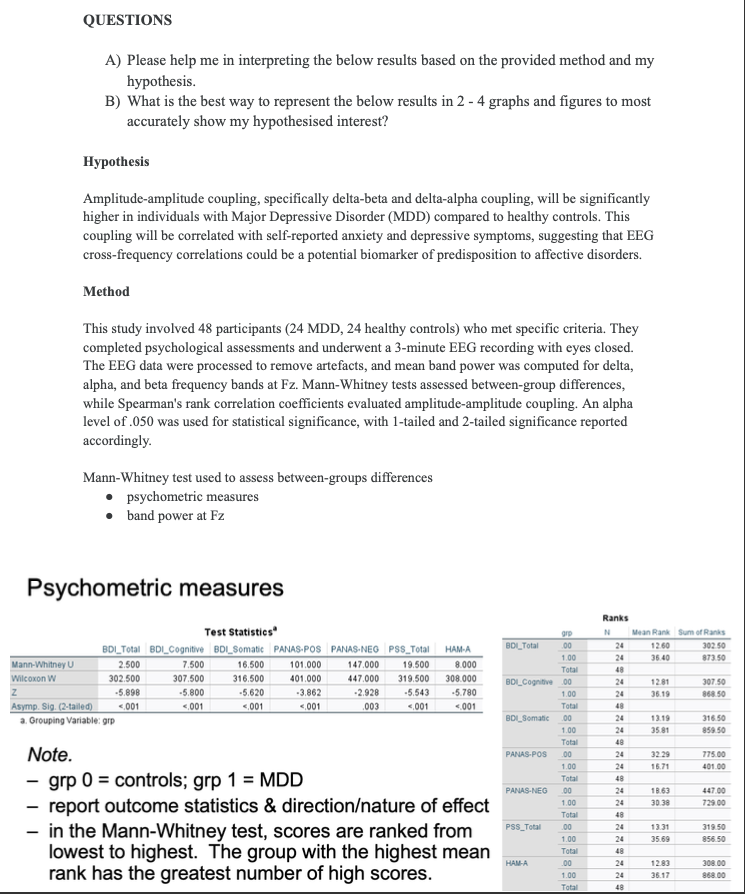
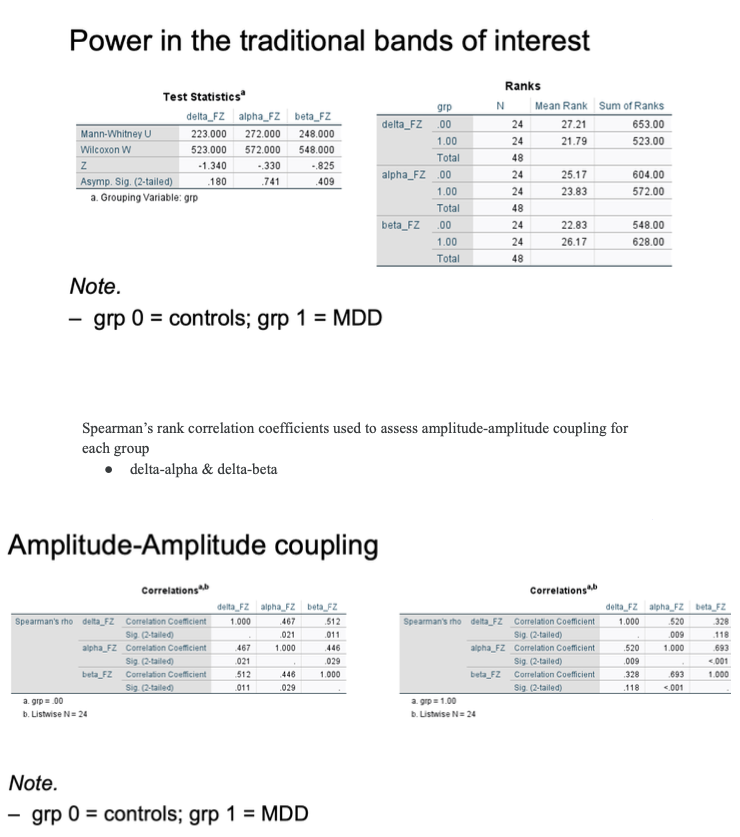
QUESTIONS A) Please help me in interpreting the below results based on the provided method and my hypothesis. B) What is the best way to represent the below results in 2 - 4 graphs and figures to most accurately show my hypothesised interest? Hypothesis Amplitude-amplitude coupling, specifically delta-beta and delta-alpha coupling, will be significantly higher in individuals with Major Depressive Disorder (MDD) compared to healthy controls. This coupling will be correlated with self-reported anxiety and depressive symptoms, suggesting that EEG cross-frequency correlations could be a potential biomarker of predisposition to affective disorders. Method This study involved 48 participants (24 MDD, 24 healthy controls) who met specific criteria. They completed psychological assessments and underwent a 3-minute EEG recording with eyes closed. The EEG data were processed to remove artefacts, and mean band power was computed for delta, alpha, and beta frequency bands at Fz. Mann-Whitney tests assessed between-group differences, while Spearman's rank correlation coefficients evaluated amplitude-amplitude coupling. An alpha level of .050 was used for statistical significance, with 1-tailed and 2-tailed significance reported accordingly. Mann-Whitney test used to assess between-groups differences psychometric measures band power at Fz Psychometric measures Ranks Test Statistics" gre Mean Rank Sum of Ranks BDI_Total BDI_Cognitive BDI_Somatic PANAS-POS PANAS-NEG PSS_Total HAM-A BOLTotal .00 24 1260 302 50 1.00 24 36 40 19.500 873.50 Mann-Whitney U 2.500 7.500 16.500 101.000 147.000 8.000 Total 48 Wilcoxon W 302.500 307.500 316.500 401.000 447.000 319.500 308.000 BOL_Cognitive 100 24 12.81 307.50 5.898 .5.800 5.620 3.862 -2.928 -5.543 .5.780 1.00 24 36.19 848 50 Asymp. Sig. (2-tailed) 1001
Step by Step Solution
There are 3 Steps involved in it

Get step-by-step solutions from verified subject matter experts