

Question: A. Plot historical prices for the six assets on the same line chart. B. Compute returns on all the assets (Asset A-F) in the
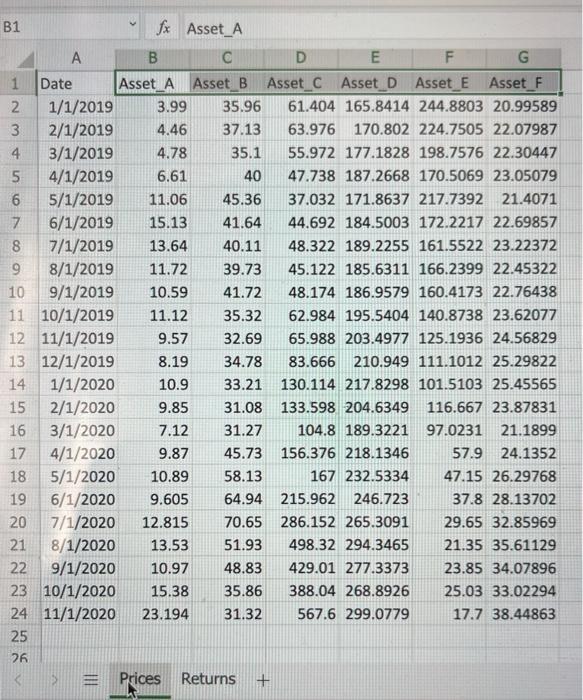
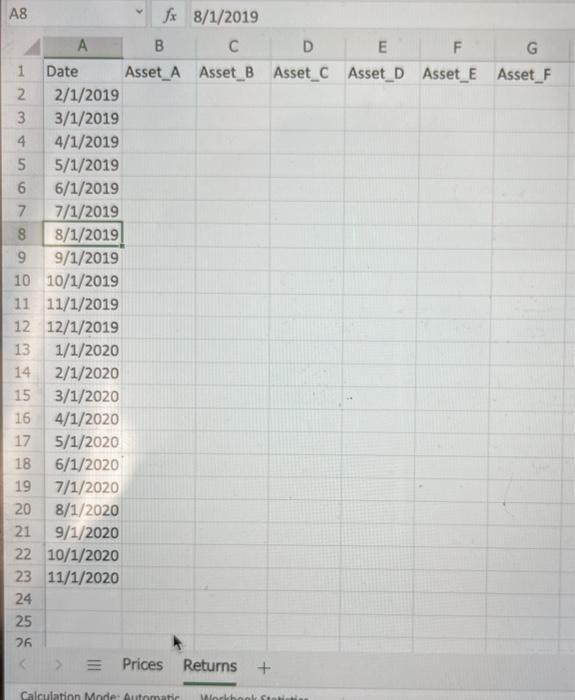
A. Plot historical prices for the six assets on the same line chart. B. Compute returns on all the assets (Asset A-F) in the 'Returns' tab. C. A portfolio allocates 20% to Asset A, 20% to ETF Asset B, 20% to Asset C, and 40% to Asset D. Compute the mean, standard deviation, skewness, kurtosis, and Sharpe Ratio of this portfolio and the four assets (A, B, C, and D). Sharpe Ratio is defined as the ratio of mean to standard deviation (assuming risk free rate is zero). D. A 130/30 trading strategy means shorting an asset up to 30% of the portfolio value and then taking the funds to long positions on other assets. Consider a 130/30 portfolio that is 50% Asset A, 30% Asset B, 50% Asset C, and -30 % Asset D. Compute the mean, standard deviation, skewness, and Sharpe Ratio of this portfolio. Compare this portfolio to the one in Question C., what do you observe? E. Regress Asset A on Asset D, Asset B on Asset D, and Asset C on Asset D and draw the following three scatter plots: Asset A vs Asset D, Asset B vs Asset D, Asset C vs Asset D. Given that Asset D is an ETF tracking the technology sector, which asset is more likely to be a technology stock? Why? F. What are your observations from Question E? Are the alphas and betas from the regressions in Question E significant? Report the alphas and betas after taking the statistical significance into consideration. G. Test if the portfolio return in Question C is significant? Why? H. Test if the portfolio return in Question C is equal to 1967 (a) write out the null and alternative hypothesis. (b) Compute the test statistic. (c) Should she reject or fail to reject the null hypothesis? 1. Considering Asset E and Asset F. Which asset provides a better hedge to the portfolio in Question C? Test and explain why. J. Test whether Asset A and Asset B are correlated. If I am telling you one is an ETF tracking bitcoin prices, and the other one is an ETF tracking avocado prices, can you provide a rationale to explain their relationship. B1 A 1 2 1/1/2019 3 2/1/2019 4 3/1/2019 5 4/1/2019 6 5/1/2019 7 6/1/2019 8 7/1/2019 9 8/1/2019 10 Date 15 16 17 18 19 20 21 fx Asset A B C Asset A Asset B 3.99 4.46 4.78 6.61 11.06 15.13 13.64 11.72 10.59 D E F G Asset C Asset D Asset E Asset F 40.11 35.96 61.404 165.8414 244.8803 20.99589 37.13 63.976 170.802 224.7505 22.07987 35.1 55.972 177.1828 198.7576 22.30447 40 47.738 187.2668 170.5069 23.05079 37.032 171.8637 217.7392 21.4071 44.692 184.5003 172.2217 22.69857 48.322 189.2255 161.5522 23.22372 45.122 185.6311 166.2399 22.45322 48.174 186.9579 160.4173 22.76438 62.984 195.5404 140.8738 23.62077 65.988 203.4977 125.1936 24.56829 83.666 210.949 111.1012 25.29822 130.114 217.8298 101.5103 25.45565 133.598 204.6349 116.667 23.87831 104.8 189.3221 97.0231 21.1899 39.73 41.72 35.32 32.69 34.78 33.21 31.08 31.27 45.73 156.376 218.1346 57.9 24.1352 58.13 167 232.5334 47.15 26.29768 64.94 215.962 246.723 37.8 28.13702 70.65 286.152 265.3091 29.65 32.85969 51.93 498.32 294.3465 21.35 35.61129 429.01 277.3373 23.85 34.07896 25.03 33.02294 35.86 388.04 268.8926 31.32 567.6 299.0779 17.7 38.44863 45.36 41.64 9/1/2019 11 10/1/2019 11.12 12 11/1/2019 9.57 13 12/1/2019 8.19 14 1/1/2020 10.9 2/1/2020 9.85 3/1/2020 7.12 4/1/2020 9.87 5/1/2020 10.89 6/1/2020 9.605 7/1/2020 12.815 13.53 10.97 48.83 8/1/2020 22 9/1/2020 23 10/1/2020 15.38 24 11/1/2020 23.194 25 26 < >E Prices Returns + A8 56 1 2 2/1/2019 3 3/1/2019 4 4/1/2019 5/1/2019 6/1/2019 7/1/2019 7 8 8/1/2019 9 9/1/2019 10 10/1/2019 11 11/1/2019 12 12/1/2019 13 1/1/2020 14 2/1/2020 15 3/1/2020 16 4/1/2020 17 5/1/2020 18 6/1/2020 19 7/1/2020 20 8/1/2020 22221 A 21 9/1/2020 22 10/1/2020 23 11/1/2020 24 25 Date fx B Asset A 8/1/2019 C Asset_B Prices Returns + D E Asset_C Asset D Calculation Mode: Automatic Workbook Statistis F G Asset_E Asset F
Step by Step Solution
There are 3 Steps involved in it
A Historical prices for the six assets can be plotted on the same line chart using a line graph B Returns on all the assets Asset A F can be computed ... View full answer

Get step-by-step solutions from verified subject matter experts