

Question: a. Plot sales versus time. b. Estimate the regression model for a linear time trend of sales. c. What is the mean absolute percent error
a. Plot sales versus time.
b. Estimate the regression model for a linear time trend of sales.
c. What is the mean absolute percent error of the linear regression estimates for these 10 years?
d. Using this model, estimate sales for year 11.
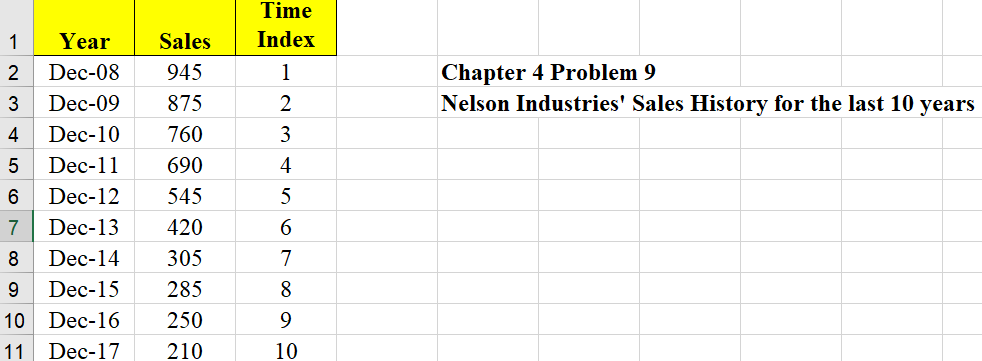
Time Index 1 Chapter 4 Problem 9 Nelson Industries' Sales History for the last 10 years 2 3 4 1 Year 2 Dec-08 3 Dec-09 4 Dec-10 5 Dec-11 6 Dec-12 7 Dec-13 8 Dec-14 9 Dec-15 10 Dec-16 11 Dec-17 Sales 945 875 760 690 545 420 305 285 250 210 5 6 7 8 9 10
Step by Step Solution
There are 3 Steps involved in it
1 Expert Approved Answer
Step: 1 Unlock

Question Has Been Solved by an Expert!
Get step-by-step solutions from verified subject matter experts
Step: 2 Unlock
Step: 3 Unlock