Question: please answer question 5 only Quarter Q1 Q2 Year 1 1 1 1 2 2 2 Q3 Q4 Q1 Q2 Q3 2 3 3 3
please answer question 5 only
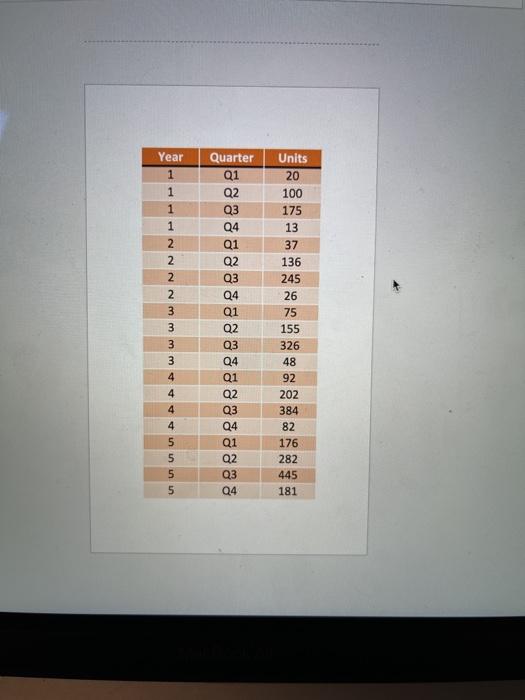
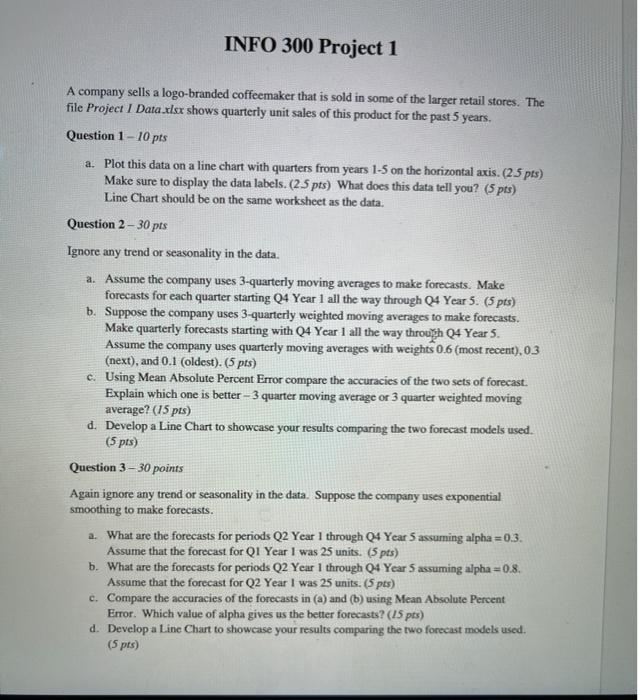
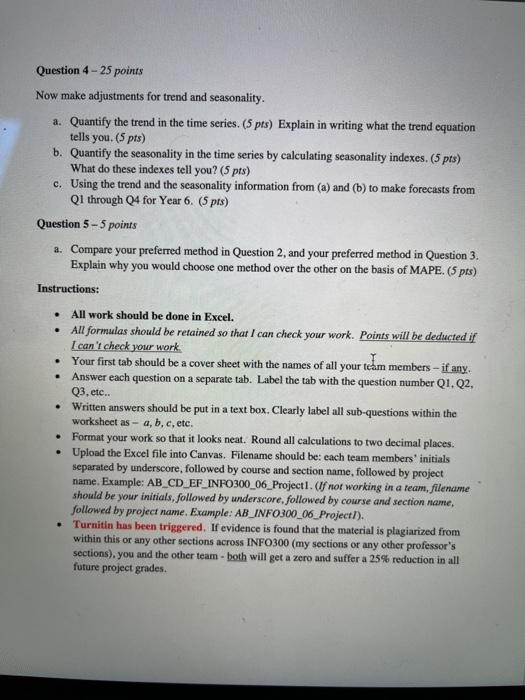
Quarter Q1 Q2 Year 1 1 1 1 2 2 2 Q3 Q4 Q1 Q2 Q3 2 3 3 3 3 4 Q4 Q1 Q2 Q3 Q4 Q1 Units 20 100 175 13 37 136 245 26 75 155 326 48 92 202 384 82 176 282 445 181 Q2 4 4 4 5 5 5 5 Q3 Q4 Q1 Q2 Q3 Q4 INFO 300 Project 1 A company sells a logo-branded coffeemaker that is sold in some of the larger retail stores. The file Project 1 Data_dsx shows quarterly unit sales of this product for the past 5 years. Question 1 - 10 pts a. Plot this data on a line chart with quarters from years 1-5 on the horizontal axis. (25 pts) Make sure to display the data labels. (25 pts) What does this data tell you? (5 pts) Line Chart should be on the same worksheet as the data. Question 2 -30 pts Ignore any trend or seasonality in the data. a. Assume the company uses 3-quarterly moving averages to make forecasts. Make forecasts for each quarter starting Q4 Year 1 all the way through Q4 Year 5. (5 pts) b. Suppose the company uses 3-quarterly weighted moving averages to make forecasts. Make quarterly forecasts starting with Q4 Year 1 all the way through Q4 Year 5. Assume the company uses quarterly moving averages with weights 0.6 (most recent), 0.3 (next), and 0.1 (oldest). (5 pts) c. Using Mean Absolute Percent Error compare the accuracies of the two sets of forecast. Explain which one is better 3 quarter moving average of 3 quarter weighted moving average? (15 pts) d. Develop a Line Chart to showcase your results comparing the two forecast models used. (5 pts) Question 3 - 30 points Again ignore any trend or seasonality in the data. Suppose the company uses exponential smoothing to make forecasts. 2. What are the forecasts for periods Q2 Year I through Q4 Year 5 assuming alpha=0.3. Assume that the forecast for Q1 Year I was 25 units. (5 pts) b. What are the forecasts for periods Q2 Year 1 through Q4 Year 5 assuming alpha=0.8. Assume that the forecast for Q2 Year I was 25 units. (5 pts) c. Compare the accuracies of the forecasts in (a) and (b) using Mean Absolute Percent Error. Which value of alpha gives us the better forecasts? (15 pts) d. Develop a Line Chart to showcase your results comparing the two forecast models used. (5 pts) . Question 4-25 points Now make adjustments for trend and seasonality. a. Quantify the trend in the time series. (5 pts) Explain in writing what the trend equation tells you. (5 pts) b. Quantify the seasonality in the time series by calculating seasonality indexes. (5 pts) What do these indexes tell you? (5 pts) c. Using the trend and the seasonality information from (a) and (b) to make forecasts from Q1 through 24 for Year 6. (5 pts) Question 5 - 5 points a. Compare your preferred method in Question 2, and your preferred method in Question 3. Explain why you would choose one method over the other on the basis of MAPE. (5 pts) Instructions: All work should be done in Excel. All formulas should be retained so that I can check your work. Points will be deducted if I can't check your work Your first tab should be a cover sheet with the names of all your team members - if any. Answer each question on a separate tab. Label the tab with the question number Q1. Q2 Q3. etc.. Written answers should be put in a text box. Clearly label all sub-questions within the worksheet as - a, b, c, etc. Format your work so that it looks neat. Round all calculations to two decimal places. Upload the Excel file into Canvas. Filename should be each team members' initials separated by underscore, followed by course and section name, followed by project name. Example: ABCD_EF_INFO300_06_Project 1. (If not working in a team, filename should be your initials, followed by underscore, followed by course and section name, followed by project name. Example: AB_INFO300_06_Project/). Turnitin has been triggered. If evidence is found that the material is plagiarized from within this or any other sections across INFO300 (my sections or any other professor's sections), you and the other team - both will get a zero and suffer a 25% reduction in all future project grades . . Quarter Q1 Q2 Year 1 1 1 1 2 2 2 Q3 Q4 Q1 Q2 Q3 2 3 3 3 3 4 Q4 Q1 Q2 Q3 Q4 Q1 Units 20 100 175 13 37 136 245 26 75 155 326 48 92 202 384 82 176 282 445 181 Q2 4 4 4 5 5 5 5 Q3 Q4 Q1 Q2 Q3 Q4 INFO 300 Project 1 A company sells a logo-branded coffeemaker that is sold in some of the larger retail stores. The file Project 1 Data_dsx shows quarterly unit sales of this product for the past 5 years. Question 1 - 10 pts a. Plot this data on a line chart with quarters from years 1-5 on the horizontal axis. (25 pts) Make sure to display the data labels. (25 pts) What does this data tell you? (5 pts) Line Chart should be on the same worksheet as the data. Question 2 -30 pts Ignore any trend or seasonality in the data. a. Assume the company uses 3-quarterly moving averages to make forecasts. Make forecasts for each quarter starting Q4 Year 1 all the way through Q4 Year 5. (5 pts) b. Suppose the company uses 3-quarterly weighted moving averages to make forecasts. Make quarterly forecasts starting with Q4 Year 1 all the way through Q4 Year 5. Assume the company uses quarterly moving averages with weights 0.6 (most recent), 0.3 (next), and 0.1 (oldest). (5 pts) c. Using Mean Absolute Percent Error compare the accuracies of the two sets of forecast. Explain which one is better 3 quarter moving average of 3 quarter weighted moving average? (15 pts) d. Develop a Line Chart to showcase your results comparing the two forecast models used. (5 pts) Question 3 - 30 points Again ignore any trend or seasonality in the data. Suppose the company uses exponential smoothing to make forecasts. 2. What are the forecasts for periods Q2 Year I through Q4 Year 5 assuming alpha=0.3. Assume that the forecast for Q1 Year I was 25 units. (5 pts) b. What are the forecasts for periods Q2 Year 1 through Q4 Year 5 assuming alpha=0.8. Assume that the forecast for Q2 Year I was 25 units. (5 pts) c. Compare the accuracies of the forecasts in (a) and (b) using Mean Absolute Percent Error. Which value of alpha gives us the better forecasts? (15 pts) d. Develop a Line Chart to showcase your results comparing the two forecast models used. (5 pts) . Question 4-25 points Now make adjustments for trend and seasonality. a. Quantify the trend in the time series. (5 pts) Explain in writing what the trend equation tells you. (5 pts) b. Quantify the seasonality in the time series by calculating seasonality indexes. (5 pts) What do these indexes tell you? (5 pts) c. Using the trend and the seasonality information from (a) and (b) to make forecasts from Q1 through 24 for Year 6. (5 pts) Question 5 - 5 points a. Compare your preferred method in Question 2, and your preferred method in Question 3. Explain why you would choose one method over the other on the basis of MAPE. (5 pts) Instructions: All work should be done in Excel. All formulas should be retained so that I can check your work. Points will be deducted if I can't check your work Your first tab should be a cover sheet with the names of all your team members - if any. Answer each question on a separate tab. Label the tab with the question number Q1. Q2 Q3. etc.. Written answers should be put in a text box. Clearly label all sub-questions within the worksheet as - a, b, c, etc. Format your work so that it looks neat. Round all calculations to two decimal places. Upload the Excel file into Canvas. Filename should be each team members' initials separated by underscore, followed by course and section name, followed by project name. Example: ABCD_EF_INFO300_06_Project 1. (If not working in a team, filename should be your initials, followed by underscore, followed by course and section name, followed by project name. Example: AB_INFO300_06_Project/). Turnitin has been triggered. If evidence is found that the material is plagiarized from within this or any other sections across INFO300 (my sections or any other professor's sections), you and the other team - both will get a zero and suffer a 25% reduction in all future project grades