

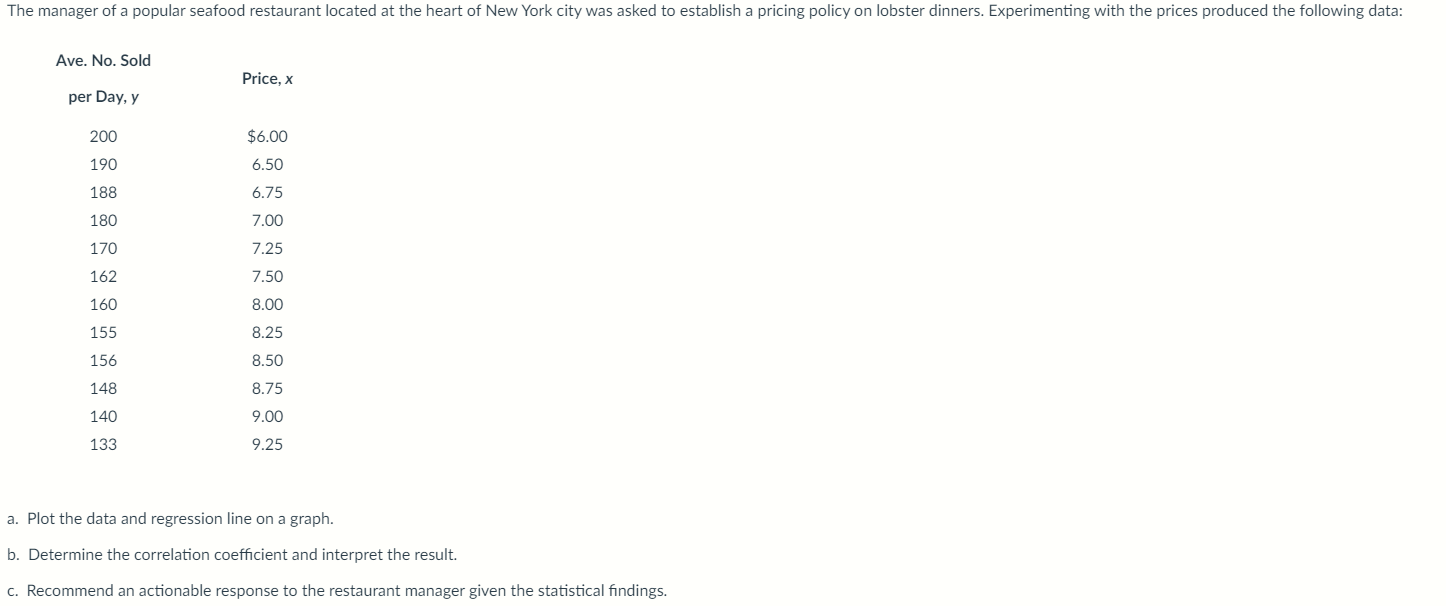
Question: a. Plot the data and regression line on a graph. b. Determine the correlation coefficient and interpret the result. c. Recommend an actionable response to
Step by Step Solution
There are 3 Steps involved in it
1 Expert Approved Answer
Step: 1 Unlock

Question Has Been Solved by an Expert!
Get step-by-step solutions from verified subject matter experts
Step: 2 Unlock
Step: 3 Unlock