

Question: For this problem, only compute and interpret MAD, MAE, MAPE. Thank you! 25. The manager of a seafood restaurant was asked to establish a pricing
For this problem, only compute and interpret MAD, MAE, MAPE. Thank you!
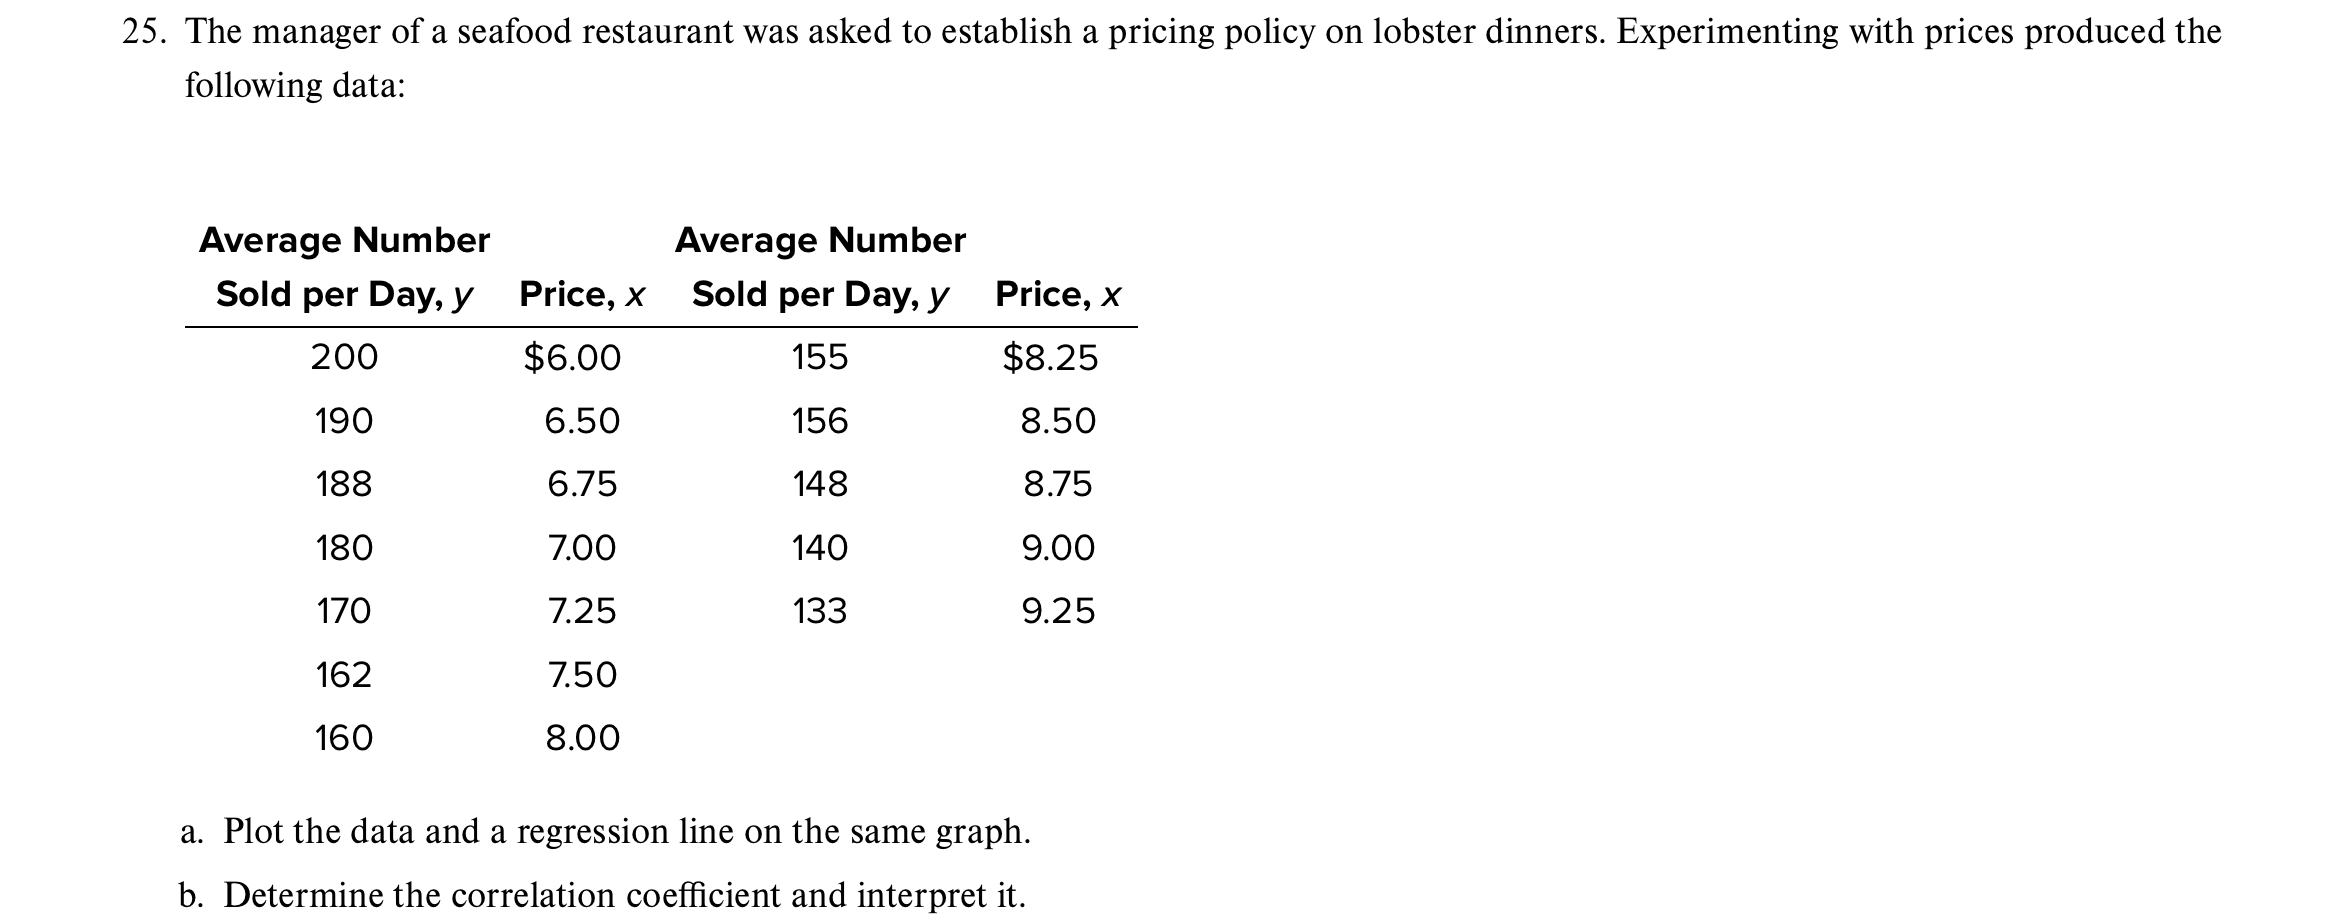
25. The manager of a seafood restaurant was asked to establish a pricing policy on lobster dinners. Experimenting with prices produced the following data: a. Plot the data and a regression line on the same graph. b. Determine the correlation coefficient and interpret it
Step by Step Solution
There are 3 Steps involved in it
1 Expert Approved Answer
Step: 1 Unlock

Question Has Been Solved by an Expert!
Get step-by-step solutions from verified subject matter experts
Step: 2 Unlock
Step: 3 Unlock