

Question: a) Plot the data (by hand, roughly), letting t = 0 correspond to 1930. Year GDP Does the GDP appear to grow linearly or exponentially?
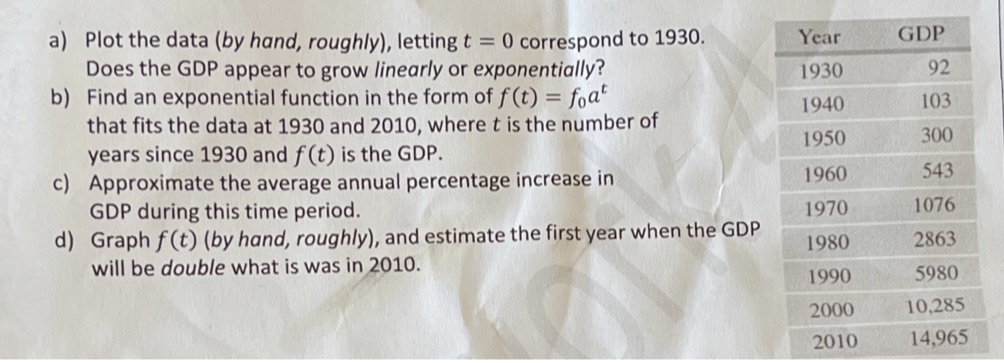

a) Plot the data (by hand, roughly), letting t = 0 correspond to 1930. Year GDP Does the GDP appear to grow linearly or exponentially? 1930 92 b) Find an exponential function in the form of f (t) = foat that fits the data at 1930 and 2010, where t is the number of 1940 103 years since 1930 and f (t) is the GDP. 1950 300 c) Approximate the average annual percentage increase in 1960 543 GDP during this time period. 1970 1076 d) Graph f(t) (by hand, roughly), and estimate the first year when the GDP 1980 2863 will be double what is was in 2010. 1990 5980 2000 10,285 2010 14,965
Step by Step Solution
There are 3 Steps involved in it
1 Expert Approved Answer
Step: 1 Unlock

Question Has Been Solved by an Expert!
Get step-by-step solutions from verified subject matter experts
Step: 2 Unlock
Step: 3 Unlock