

Question: a. Plot the data. How do you interpret the nature of the variation in the graph b. Create a series of forecasts for October to
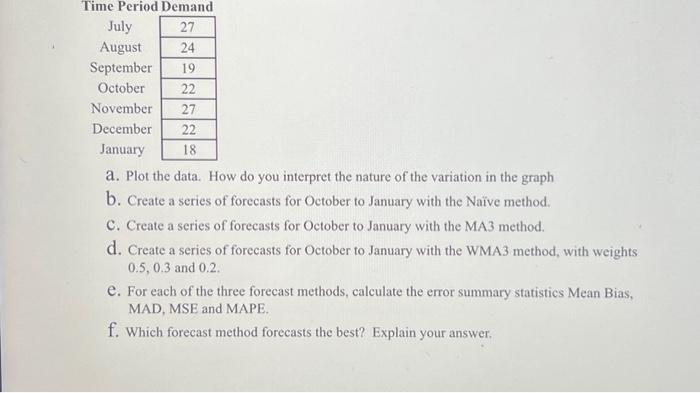
a. Plot the data. How do you interpret the nature of the variation in the graph b. Create a series of forecasts for October to January with the Nave method. c. Create a series of forecasts for October to January with the MA3 method. d. Create a series of forecasts for October to January with the WMA3 method, with weights 0.5,0.3 and 0.2 . e. For each of the three forecast methods, calculate the error summary statistics Mean Bias, MAD, MSE and MAPE. f. Which forecast method forecasts the best? Explain your
Step by Step Solution
There are 3 Steps involved in it
1 Expert Approved Answer
Step: 1 Unlock

Question Has Been Solved by an Expert!
Get step-by-step solutions from verified subject matter experts
Step: 2 Unlock
Step: 3 Unlock