

Question: a. Plot the data on a scattergram with the S&P index on the vertical axis and CPI on the horizontal axis. b. What do you
a. Plot the data on a scattergram with the S&P index on the vertical axis and CPI on the horizontal axis.
b. What do you expect the relationship between the two indexes to be from economic theory? What can you say about this relationship from the graph in (a)?
c. Consider the following regression model:
? ? ? ? ? ? (S&P) t = B 1 + B 2 CPI t + u t
? ? ? Use the method of least squares to estimate this model from the preceding data and interpret your results. Do the calculations ?by hand.? (You may use a calculator or you may set up and do the calculations in Excel, but do not use any Excel statistical procedures).
d. Do the results obtained in part (c) make economic sense?
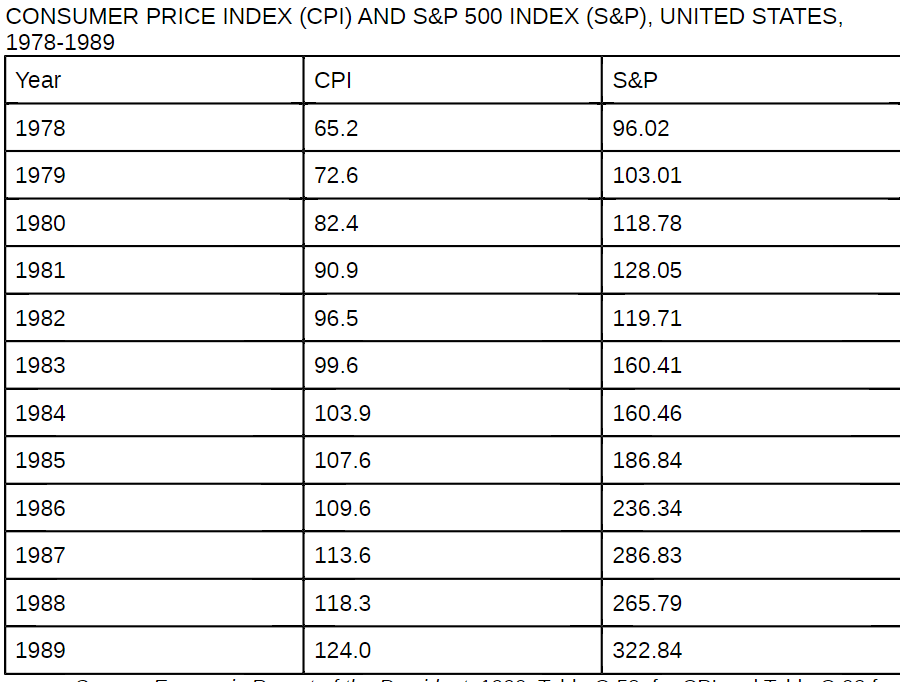
CONSUMER PRICE INDEX (CPI) AND S&P 500 INDEX (S&P), UNITED STATES, 1978-1989 Year 1978 1979 1980 1981 1982 1983 1984 1985 1986 1987 1988 1989 CPI 65.2 72.6 82.4 90.9 96.5 99.6 103.9 107.6 109.6 113.6 118.3 124.0 S&P 96.02 103.01 118.78 128.05 119.71 160.41 160.46 186.84 236.34 286.83 265.79 322.84
Step by Step Solution
3.44 Rating (144 Votes )
There are 3 Steps involved in it
Answer Lets go through each part step by step a Plot the Data on a Scattergram Well create a scatter plot with CPI on the horizontal axis and the SP i... View full answer

Get step-by-step solutions from verified subject matter experts