

Question: a) Plot the data presented in Exercise 7 to examine the possible existence of trend and seasonality in the data. b) Prepare three separate exponential
a) Plot the data presented in Exercise 7 to examine the possible existence of trend and seasonality in the data.
b) Prepare three separate exponential smoothing models to forecast the full-servise restuarant sales data using the monthly data. (1. A smimple smoothing model, 2. Holt's model, 3. Winters' Model
c) examine the accuracy of each model by calculating the mean absolute percentage error for each during the historical period. Explain carefully what characteristics of the original data led one of these models to have the lowest MAPE.
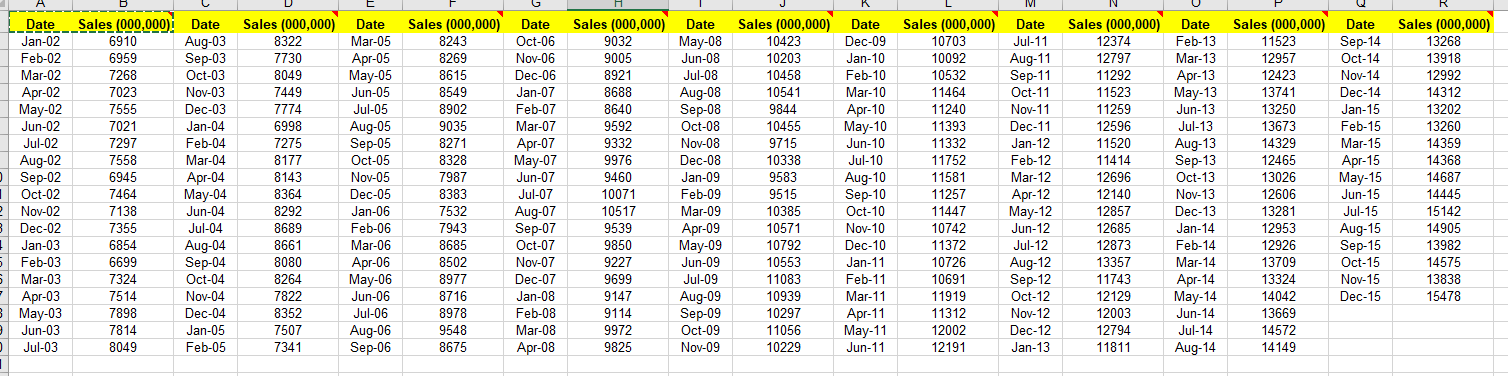
Sales (000,000) 8322 7730 8049 7449 7774 6998 7275 LA Date Jan-02 Feb-02 Mar-02 Apr-02 May-02 Jun-02 Jul-02 Aug-02 Sep-02 Oct-02 2 Nov-02 3 Dec-02 Jan-03 Feb-03 Mar-03 Apr-03 3 May-03 Jun-03 Jul-03 Sales (000,000); Date 6910 Aug-03 6959 Sep-03 7268 Oct-03 7023 Nov-03 7555 Dec-03 7021 Jan-04 7297 Feb-04 7558 Mar-04 6945 Apr-04 7464 May-04 7138 Jun-04 7355 Jul-04 6854 Aug-04 6699 Sep-04 7324 Oct-04 7514 Nov-04 7898 Dec-04 7814 Jan-05 8049 Feb-05 8177 8143 8364 8292 8689 8661 8080 8264 7822 8352 7507 7341 Date Mar-05 Apr-05 May-05 Jun-05 Jul-05 Aug-05 Sep-05 Oct-05 Nov-05 Dec-05 Jan-06 Feb-06 Mar-06 Apr-06 May-06 Jun-06 Jul-06 Aug-06 Sep-06 Sales (000,000) 8243 8269 8615 8549 8902 9035 8271 8328 7987 8383 7532 7943 8685 8502 8977 8716 8978 9548 8675 Date Oct-06 Nov-06 Dec-06 Jan-07 Feb-07 Mar-07 Apr-07 May-07 Jun-07 Jul-07 Aug-07 Sep-07 Oct-07 Nov-07 Dec-07 Jan-08 Feb-08 Mar-08 Apr-08 Sales (000,000) 9032 9005 8921 8688 8640 9592 9332 9976 9460 10071 10517 9539 9850 9227 9699 9147 9114 9972 9825 Date May-08 Jun-08 Jul-08 Aug-08 Sep-08 Oct-08 Nov-08 Dec-08 Jan-09 Feb-09 Mar-09 Apr-09 May-09 Jun-09 Jul-09 Aug-09 Sep-09 Oct-09 Nov-09 Sales (000,000) 10423 10203 10458 10541 9844 10455 9715 10338 9583 9515 10385 10571 10792 10553 11083 10939 10297 11056 10229 Date Dec-09 Jan-10 Feb-10 Mar-10 Apr-10 May-10 Jun-10 Jul-10 Aug-10 Sep-10 Oct-10 Nov-10 Dec-10 Jan-11 Feb-11 Mar-11 Apr-11 May-11 Jun-11 Sales (000,000) 10703 10092 10532 11464 11240 11393 11332 11752 11581 11257 11447 10742 11372 10726 10691 11919 11312 12002 12191 Date Jul-11 Aug-11 Sep-11 Oct-11 Nov-11 Dec-11 Jan-12 Feb-12 Mar-12 Apr-12 May-12 Jun-12 Jul-12 Aug-12 Sep-12 Oct-12 Nov-12 Dec-12 Jan-13 Sales (000,000) 12374 12797 11292 11523 11259 12596 11520 11414 12696 12140 12857 12685 12873 13357 11743 12129 12003 12794 11811 Date Feb-13 Mar-13 Apr-13 May-13 Jun-13 Jul-13 Aug-13 Sep-13 Oct-13 Nov-13 Dec-13 Jan-14 Feb-14 Mar-14 Apr-14 May-14 Jun-14 Jul-14 Aug-14 Sales (000,000) 11523 12957 12423 13741 13250 13673 14329 12465 13026 12606 13281 12953 12926 13709 13324 14042 13669 14572 1 4149 Date Sep-14 Oct-14 Nov-14 Dec-14 Jan-15 Feb-15 Mar-15 Apr-15 May-15 Jun-15 Jul-15 Aug-15 Sep-15 Oct-15 Nov-15 Dec-15 Sales (000,000) 13268 13918 12992 14312 13202 13260 14359 14368 14687 14445 15142 14905 13982 14575 13838 15478Step by Step Solution
There are 3 Steps involved in it
1 Expert Approved Answer
Step: 1 Unlock

Question Has Been Solved by an Expert!
Get step-by-step solutions from verified subject matter experts
Step: 2 Unlock
Step: 3 Unlock