

Question: a) Plot the effective pressure diagram at point A, B and C. b) If the ground water table rises to 2 m below the
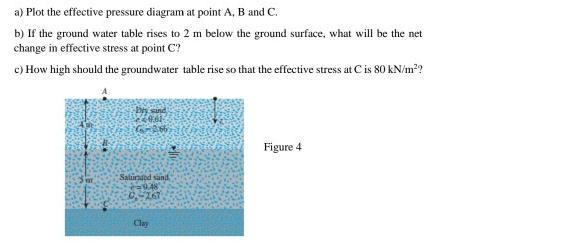
a) Plot the effective pressure diagram at point A, B and C. b) If the ground water table rises to 2 m below the ground surface, what will be the net change in effective stress at point C? c) How high should the groundwater table rise so that the effective stress at C is 80 kN/m? by sand 20.61 Com 366 Figure 4 Saluraded sand 9.48 0-267 Clay
Step by Step Solution
★★★★★
3.43 Rating (150 Votes )
There are 3 Steps involved in it
1 Expert Approved Answer
Step: 1 Unlock

Question Has Been Solved by an Expert!
Get step-by-step solutions from verified subject matter experts
Step: 2 Unlock
Step: 3 Unlock