

Question: a. Plot the intensity distribution curve with labels and legends. (10 points) b. Describe in a paragraph, what kind of fixture you think it is.
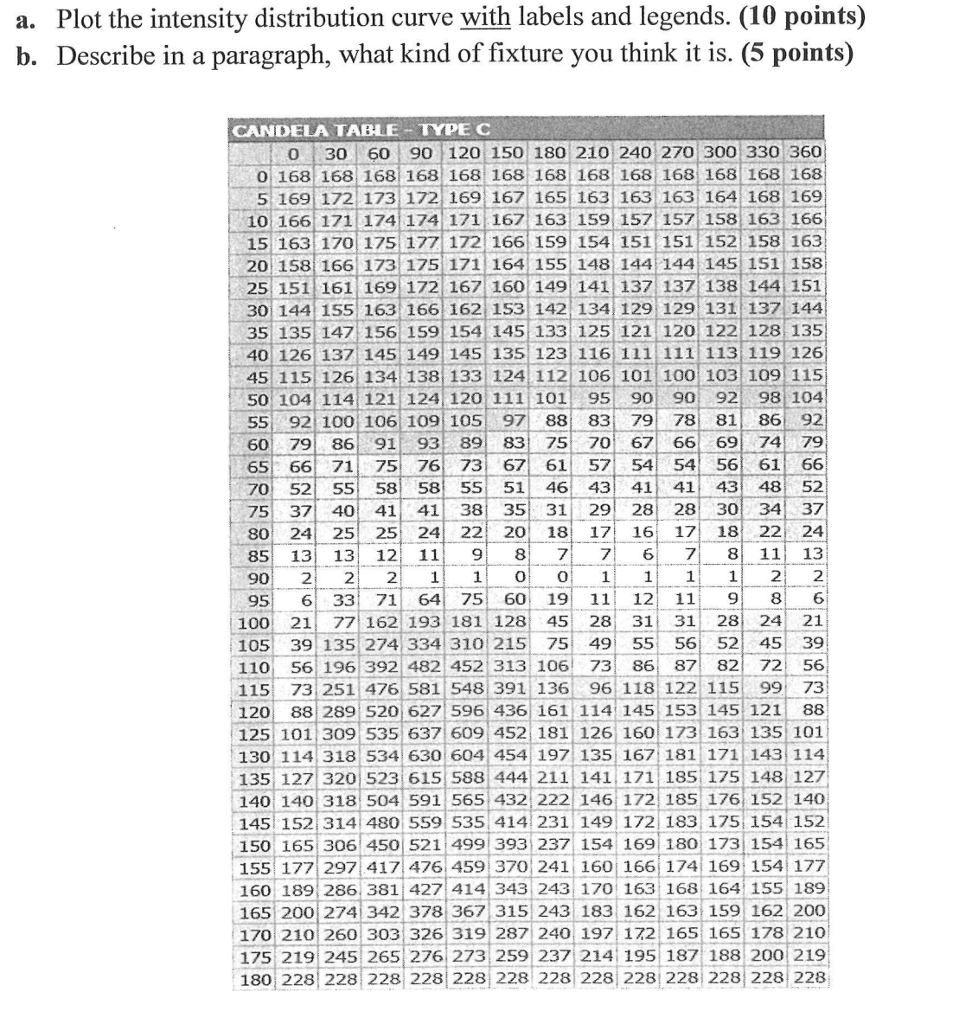
a. Plot the intensity distribution curve with labels and legends. (10 points) b. Describe in a paragraph, what kind of fixture you think it is. (5 points) CANDELA TABLE TYPEC 0 30 60 90 120 150 180 210 240 270 300 330 360 0 168 168 168 168 168 168 168 168 168 168 168 168 168 5 169 172 173 172 169 167 165 163 163 163 164 168 169 10 166 171 174 174 171 167 163 159 157 157 158 163 166 15 163 170 175 177 172 166 159 154 151 151 152 158 163 20158 166 173 175 171 164 155 148 144 144 145 151 158 25 151 161 169 172 167 160 149 141 137 137 138 144 151 30 144 155 163 166 162 153 142 134 129 129 131 137 144 35 135 147 156 159 154 145 133 125 121 120 122 128 135 45 115 126 134 138 133 124 112 106 101 100 103 109 115 50 104 114 121 124 120 111 101 95 90 90 92 98 104 55 92 100 106 109 105 97 88 83 79 78 81 86 92 60 79 8691 93 89 83 75 70 6766 69 7479 65 66 71 75 7673 67 61 5754 54 56 61 66 70 52 55 58 58 55 51 46 43 41 41 43 4852 75 37 4041 41 38 35 31 29 28 28 30 34 37 80 24 25 25 24 22 2018 17 16 17 18 22 24 85 13 1312 11987 7 678 11 13 95 6 33 7164 75 60 19 11 12 11 986 100 2177 162 193 181 128 45 2831 31 28 24 21 105 39 135 274 334 310 215 75 49 55 56 5245 39 110 56 196 392 482 452 313 10673 86 87 82 72 56 115 73 251 476 581 548 391 136 96 118 122 115 99 73 120 88 289 520 627 596 436 161 114 145 153 145 121 88 125 101 309 535 637 609 452 181 126 160 173 163 135 101 130 114 318 534 630 604 454 197 135 167 181 171 143 114 135 127 320 523 615 588 444 211 141 171 185 175 148 127 140 140 318 504 591 565 432 222 146 172 185 176, 152 140 145 152 314 480 559 535 414 231 149 172 183 175 154 152 150 165 306 450 521 499 393 237 154 169 180 173 154 165 155 177 297 417 476 459 370 241160 166 174 169 154 177 160 189 286 381 427 414 343 243 170 163 168 164 155 189 165 200 274 342 378 367 315 243 183 162 163 159 162 200 170 210 260 303 326 319 287 240 197 172 165 165 178 210 175 219 245 265 276 273 259 237 214 195 187 188 200 219 180 228 228 228 228 228 228 228 228 228 228 228 228 228 a. Plot the intensity distribution curve with labels and legends. (10 points) b. Describe in a paragraph, what kind of fixture you think it is. (5 points) CANDELA TABLE TYPEC 0 30 60 90 120 150 180 210 240 270 300 330 360 0 168 168 168 168 168 168 168 168 168 168 168 168 168 5 169 172 173 172 169 167 165 163 163 163 164 168 169 10 166 171 174 174 171 167 163 159 157 157 158 163 166 15 163 170 175 177 172 166 159 154 151 151 152 158 163 20158 166 173 175 171 164 155 148 144 144 145 151 158 25 151 161 169 172 167 160 149 141 137 137 138 144 151 30 144 155 163 166 162 153 142 134 129 129 131 137 144 35 135 147 156 159 154 145 133 125 121 120 122 128 135 45 115 126 134 138 133 124 112 106 101 100 103 109 115 50 104 114 121 124 120 111 101 95 90 90 92 98 104 55 92 100 106 109 105 97 88 83 79 78 81 86 92 60 79 8691 93 89 83 75 70 6766 69 7479 65 66 71 75 7673 67 61 5754 54 56 61 66 70 52 55 58 58 55 51 46 43 41 41 43 4852 75 37 4041 41 38 35 31 29 28 28 30 34 37 80 24 25 25 24 22 2018 17 16 17 18 22 24 85 13 1312 11987 7 678 11 13 95 6 33 7164 75 60 19 11 12 11 986 100 2177 162 193 181 128 45 2831 31 28 24 21 105 39 135 274 334 310 215 75 49 55 56 5245 39 110 56 196 392 482 452 313 10673 86 87 82 72 56 115 73 251 476 581 548 391 136 96 118 122 115 99 73 120 88 289 520 627 596 436 161 114 145 153 145 121 88 125 101 309 535 637 609 452 181 126 160 173 163 135 101 130 114 318 534 630 604 454 197 135 167 181 171 143 114 135 127 320 523 615 588 444 211 141 171 185 175 148 127 140 140 318 504 591 565 432 222 146 172 185 176, 152 140 145 152 314 480 559 535 414 231 149 172 183 175 154 152 150 165 306 450 521 499 393 237 154 169 180 173 154 165 155 177 297 417 476 459 370 241160 166 174 169 154 177 160 189 286 381 427 414 343 243 170 163 168 164 155 189 165 200 274 342 378 367 315 243 183 162 163 159 162 200 170 210 260 303 326 319 287 240 197 172 165 165 178 210 175 219 245 265 276 273 259 237 214 195 187 188 200 219 180 228 228 228 228 228 228 228 228 228 228 228 228 228
Step by Step Solution
There are 3 Steps involved in it

Get step-by-step solutions from verified subject matter experts