

Question: A. Plot the monthly data on a sheet of graph paper. B. Compute the sales forecast for July using the following approaches: (1) a three-month
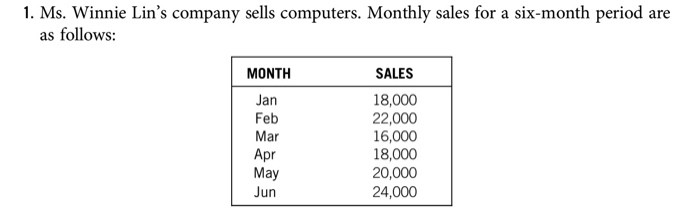
A. Plot the monthly data on a sheet of graph paper.
B. Compute the sales forecast for July using the following approaches: (1) a three-month moving average; (2) a weighted three-month moving average using .50 for June, .30 for May and .20 for April; (3) a linear trend equation (4) exponential smoothing with a (smoothing constant) equal to 40, assuming a February forecast of 18,000
C. Which method do you think is the least appropriate? Why?
D. Calculate the MAD for each of the four techniques in part (1). Which is the best? Why?"
Step by Step Solution
There are 3 Steps involved in it
1 Expert Approved Answer
Step: 1 Unlock

Question Has Been Solved by an Expert!
Get step-by-step solutions from verified subject matter experts
Step: 2 Unlock
Step: 3 Unlock