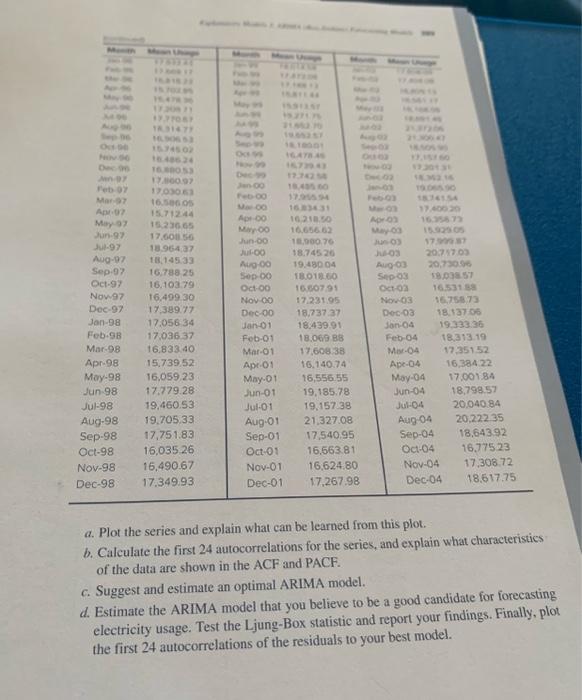
Question: a. Plot the series and explain what can be learned from this plot. b. Calculate the first 24 autocorrelations for the series, and explain what

a. Plot the series and explain what can be
a. Plot the series and explain what can be learned from this plot. b. Calculate the first 24 autocorrelations for the series, and explain what characteristics of the data are shown in the ACF and PACF. c. Suggest and estimate an optimal ARIMA model. d. Estimate the ARIMA model that you believe to be a good candidate for forecasting electricity usage. Test the Ljung-Box statistic and report your findings. Finally, plot the first 24 autocorrelations of the residuals to your best model. a. Plot the series and explain what can be learned from this plot. b. Calculate the first 24 autocorrelations for the series, and explain what characteristics of the data are shown in the ACF and PACF. c. Suggest and estimate an optimal ARIMA model. d. Estimate the ARIMA model that you believe to be a good candidate for forecasting electricity usage. Test the Ljung-Box statistic and report your findings. Finally, plot the first 24 autocorrelations of the residuals to your best model

Step by Step Solution

There are 3 Steps involved in it

1 Expert Approved Answer
Step: 1 Unlock blur-text-image
Question Has Been Solved by an Expert!

Get step-by-step solutions from verified subject matter experts

Step: 2 Unlock
Step: 3 Unlock

Students Have Also Explored These Related General Management Questions!