Question:
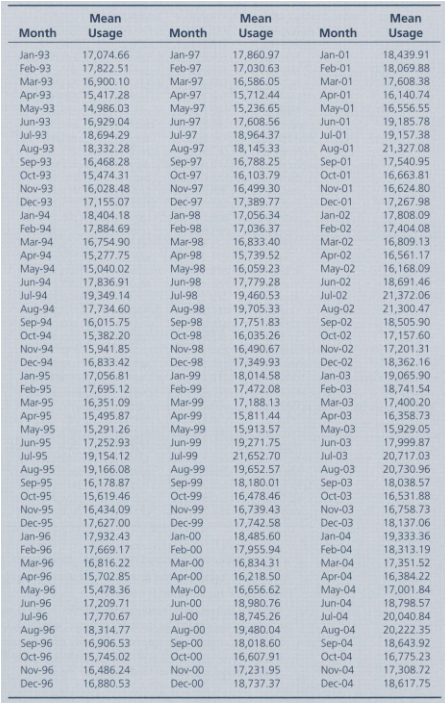
The data below shows the average hourly megawatts of electricity used in New York City for the years 1993 through 2004.
a. Plot the series and explain what can be learned from this plot.
b. Calculate the first 24 autocorrelations for the series, and explain what characteristics of the data are shown in the ACF and PACF.
c. Suggest and estimate an optimal ARIMA model.
d. Estimate the ARIMA model that you believe to be a good candidate for forecasting electricity usage. Test the Ljung-Box statistic and report your findings. Finally, plot the first 24 autocorrelations of the residuals to your best model.
Transcribed Image Text:
Mean Mean Mean Month Month Usage Month Usage Usage Jan-93 17,074.66 17,822.51 16,900.10 15,417.28 Jan-97 17,860.97 17,030.63 Jan-01 18,439.91 18,069.88 17,608.38 Feb-93 Mar-93 Feb-97 Feb-01 Mar-97 16,586.05 15,712.44 15,236.65 Mar-01 16,140.74 16,556.55 Apr-93 May-93 Apr-97 May-97 Apr-01 May-01 14,986.03 16,929.04 18,694.29 18,332.28 16,468.28 15,474.31 16,028.48 17,608.56 18,964.37 19,185.78 19,157.38 21,327.08 Jun-93 Jun-97 Jun-01 Jul-01 Jul-93 Jul-97 Aug-93 Sep-93 Aug-97 Sep-97 Oct-97 Nov-97 Dec-97 18,145.33 16,788.25 16,103.79 16,499.30 Aug-01 Sep-01 Oct-01 17,540.95 16,663.81 16,624.80 17,267.98 17,808.09 17,404.08 16,809.13 16,561.17 16,168.09 18,691.46 21,372.06 21,300.47 18,505.90 17,157.60 17,201.31 18,362.16 19,065.90 18,741.54 17,400.20 16,358.73 15,929.05 17,999.87 20,717.03 20,730.96 Oct-93 Nov-93 Nov-01 Dec-01 Dec-93 17,155.07 18,404.18 17,389.77 17,056.34 Jan-94 Jan-98 Jan-02 17,036.37 16,833.40 15,739.52 16,059.23 17,779.28 19,460.53 19,705.33 17,751.83 Feb-94 17,884.69 16,754.90 Feb-98 Feb-02 Mar-94 Mar-98 Mar-02 Apr-98 May-98 Apr-94 May-94 Jun-94 15,277.75 15,040.02 17,836.91 Apr-02 May-02 Jun-02 Jun-98 Jul-94 19,349.14 17,734.60 16,015.75 Jul-98 Jul-02 Aug-02 Sep-02 Oct-02 Aug-94 Sep-94 Oct-94 Aug-98 Sep-98 15,382.20 15,941.85 16,833.42 17,056.81 17,695.12 16,351.09 15,495.87 15,291.26 17,252.93 Oct-98 16,035.26 16,490.67 17,349.93 Nov-98 Nov-94 Nov-02 Dec-94 Dec-98 Dec-02 18,014.58 17,472.08 17,188.13 15,811.44 15,913.57 19,271.75 Jan-03 Feb-03 Jan-95 Jan-99 Feb-95 Feb-99 Mar-95 Mar-99 Mar-03 Аpг-99 May-99 Jun-99 Jul-99 Apr-03 May-03 Jun-03 Jul-03 Aug-03 Sep-03 Oct-03 Apr-95 May-95 Jun-95 Jul-95 19,154.12 21,652.70 Aug-95 Sep-95 Aug-99 Sep-99 19,166.08 16,178.87 15,619.46 16,434.09 17,627.00 19,652.57 18,180.01 16,478.46 16,739.43 17,742.58 18,485.60 18,038.57 16,531.88 16,758.73 18,137.06 19,333.36 Oct-95 Oct-99 Nov-95 Nov-99 Dec-99 Nov-03 Dec-03 Dec-95 Jan-96 17,932.43 17,669.17 16,816.22 15,702.85 15,478.36 17,209.71 17,770.67 18,314.77 Jan-00 Jan-04 Feb-00 Mar-00 Apr-00 May-00 18,313.19 17,351.52 16,384.22 Feb-96 17,955.94 16,834.31 Feb-04 Mar-96 Apr-96 May-96 Jun-96 Mar-04 16,218.50 16,656.62 18,980.76 Apr-04 May-04 17,001.84 18,798.57 Jun-00 Jun-04 Jul-00 Aug-00 Sep-00 Oct-00 20,040.84 20,222.35 18,643. Jul-96 18,745.26 19,480.04 18,018.60 Jul-04 Aug-96 Sep-96 Oc-96 Aug-04 Sep-04 Oct-04 16,906.53 15,745.02 16,486.24 16,607.91 17,231.95 18,737.37 16,775.23 17,308.72 18,617.75 Nov-00 Dec-00 Nov-04 Dec-04 Nov-96 Dec-96 16,880.53