

Question: A population that is uniformly distributed between a = 0 and b = 10 is given in sample sizes 50(), 100(), 250(), and 500(
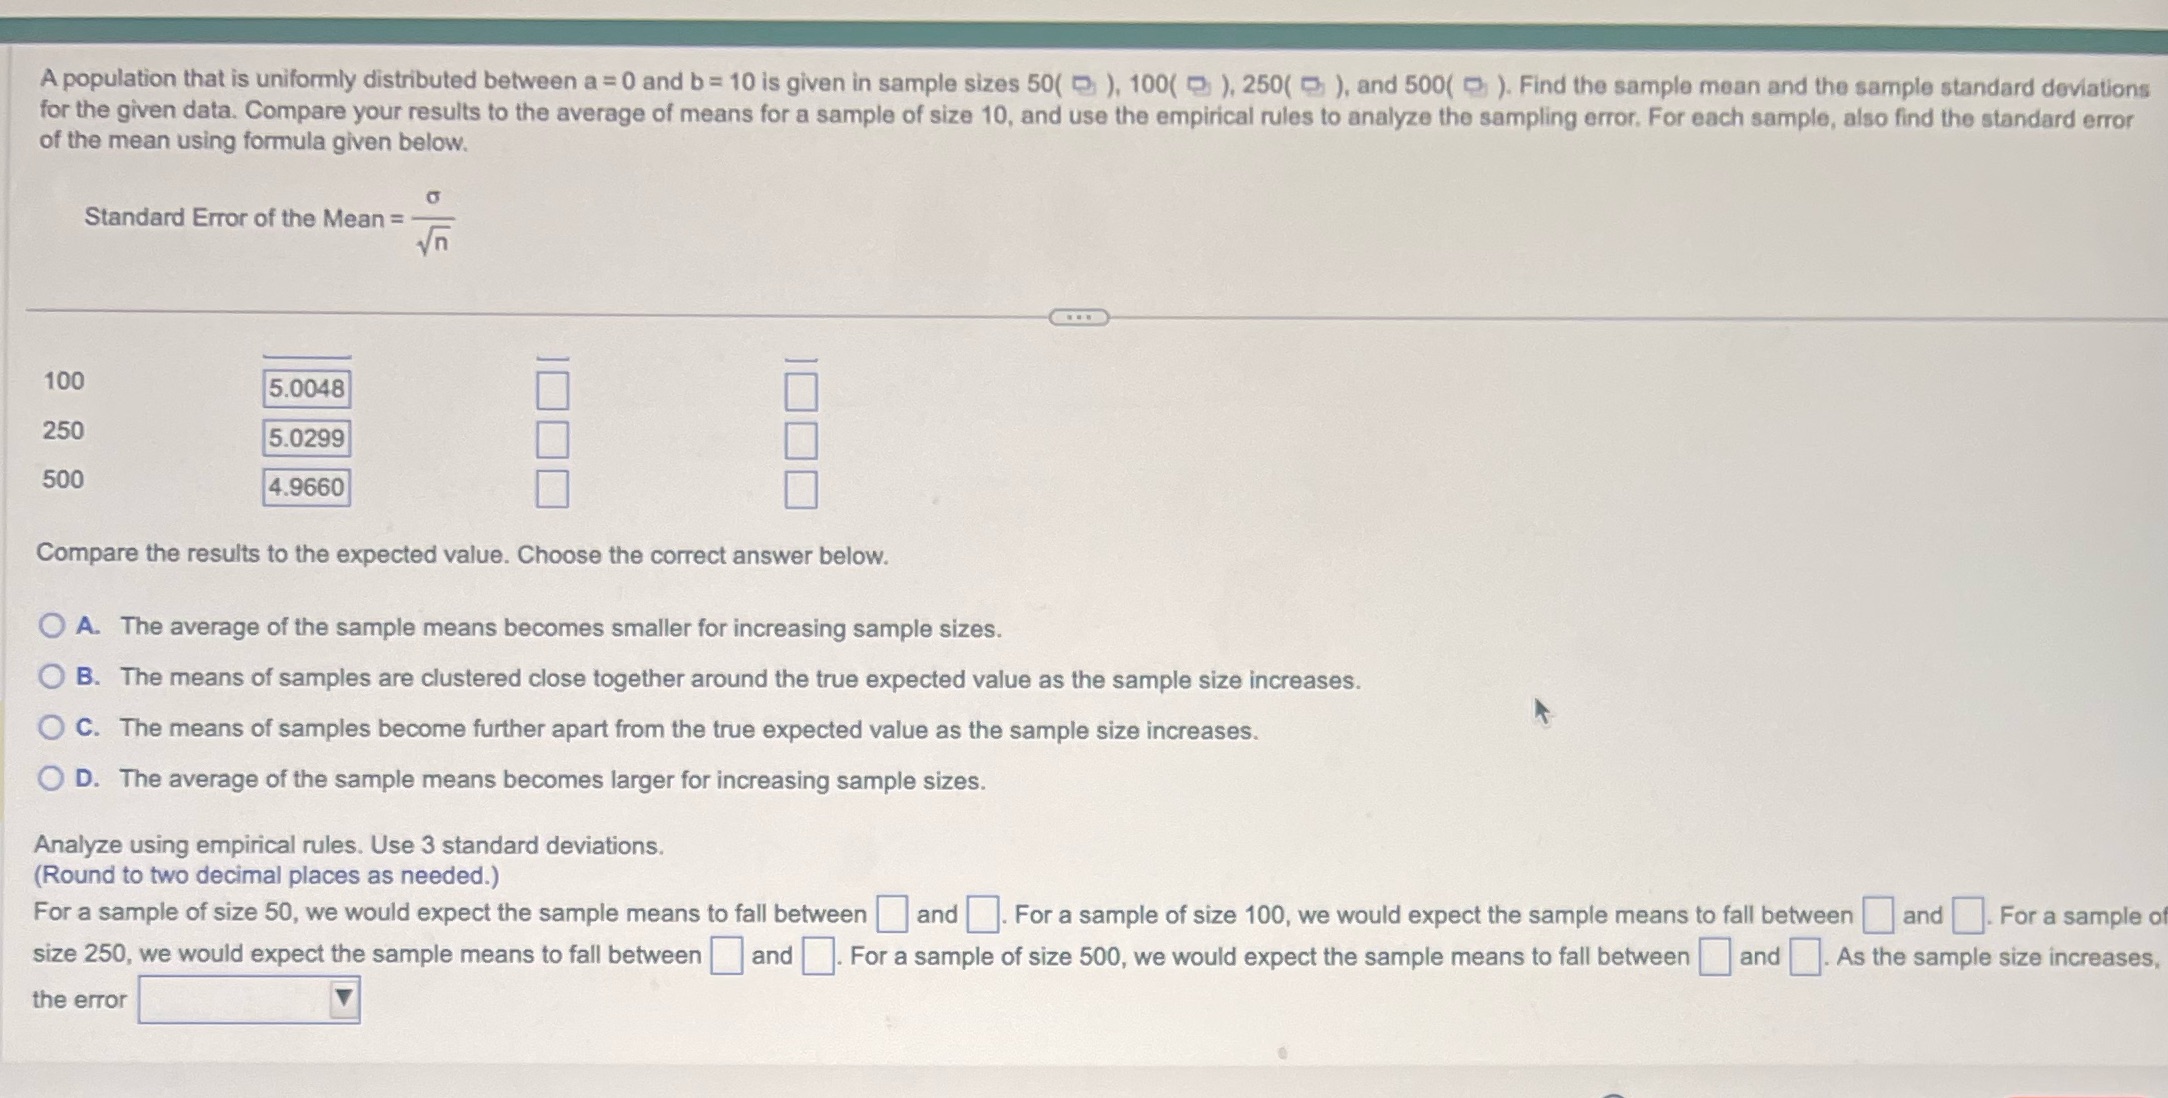
A population that is uniformly distributed between a = 0 and b = 10 is given in sample sizes 50(), 100(), 250(), and 500( ). Find the sample mean and the sample standard deviations for the given data. Compare your results to the average of means for a sample of size 10, and use the empirical rules to analyze the sampling error. For each sample, also find the standard error of the mean using formula given below. Standard Error of the Mean = 100 5.0048 250 5.0299 500 4.9660 Compare the results to the expected value. Choose the correct answer below. OA. The average of the sample means becomes smaller for increasing sample sizes. B. The means of samples are clustered close together around the true expected value as the sample size increases. C. The means of samples become further apart from the true expected value as the sample size increases. OD. The average of the sample means becomes larger for increasing sample sizes. Analyze using empirical rules. Use 3 standard deviations. (Round to two decimal places as needed.) For a sample of size 50, we would expect the sample means to fall between and . For a sample of size 100, we would expect the sample means to fall between and For a sample of size 250, we would expect the sample means to fall between and . For a sample of size 500, we would expect the sample means to fall between and As the sample size increases, the error
Step by Step Solution
There are 3 Steps involved in it

Get step-by-step solutions from verified subject matter experts