

Question: A portfolio manager summarizes the input from the macro and micro forecasts in the following table: Micro Forecasts Expected Return (%) Asset Stock A Stock
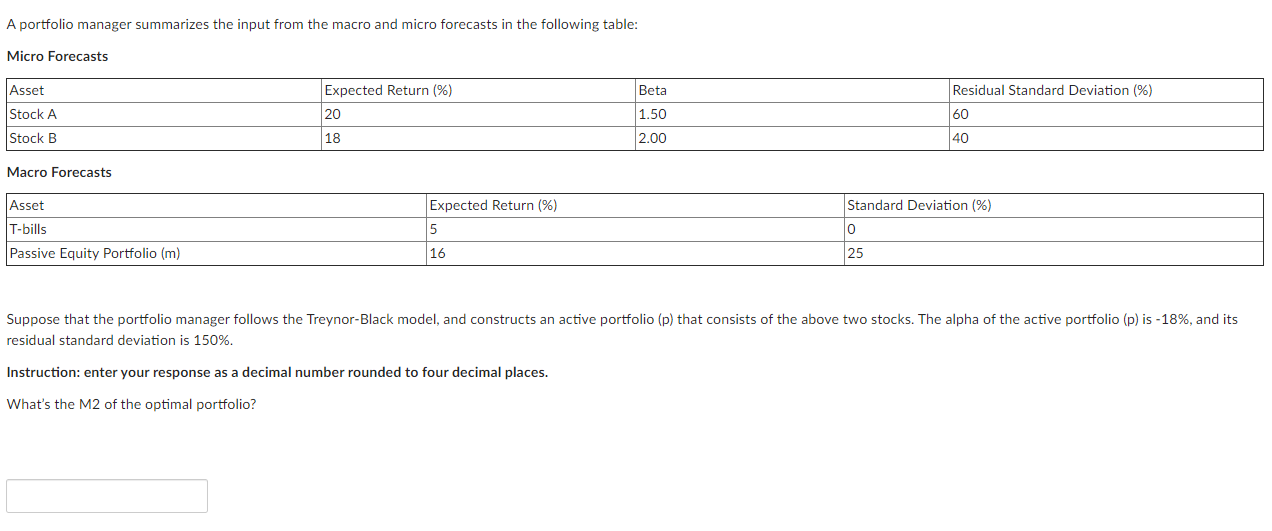
A portfolio manager summarizes the input from the macro and micro forecasts in the following table: Micro Forecasts Expected Return (%) Asset Stock A Stock B 20 Beta 1.50 2.00 Residual Standard Deviation (%) 60 40 18 Macro Forecasts Expected Return (%) Standard Deviation (%) Asset T-bills 5 0 Passive Equity Portfolio (m) 16 25 Suppose that the portfolio manager follows the Treynor-Black model, and constructs an active portfolio (p) that consists of the above two stocks. The alpha of the active portfolio (p) is -18%, and its residual standard deviation is 150%. Instruction: enter your response as a decimal number rounded to four decimal places. What's the M2 of the optimal portfolio? A portfolio manager summarizes the input from the macro and micro forecasts in the following table: Micro Forecasts Expected Return (%) Asset Stock A Stock B 20 Beta 1.50 2.00 Residual Standard Deviation (%) 60 40 18 Macro Forecasts Expected Return (%) Standard Deviation (%) Asset T-bills 5 0 Passive Equity Portfolio (m) 16 25 Suppose that the portfolio manager follows the Treynor-Black model, and constructs an active portfolio (p) that consists of the above two stocks. The alpha of the active portfolio (p) is -18%, and its residual standard deviation is 150%. Instruction: enter your response as a decimal number rounded to four decimal places. What's the M2 of the optimal portfolio
Step by Step Solution
There are 3 Steps involved in it

Get step-by-step solutions from verified subject matter experts