

Question: a. Present this data as a fully labelled scattergram. The chart should include an informative caption. The chart should be created using Excel or a
- a. Present this data as a fully labelled scattergram. The chart should include an informative caption. The chart should be created using Excel or a similar tool, and should include a trend line.
b. Inspection of the timber produced from the harvest reveals that one of the trees harvested was NOT a blackbutt tree, but another species with very different yield characteristics. From your scattergram in part (a) identify which point is most likely to correspond to this different tree. Explain what impact the inclusion of data for this tree would have had on the trendline that you included in your diagram.
c. Remove the point that you identified in part (b) from your data set. Using the remaining 29 data points, find the ordinary least squares (OLS) line of best fit that uses CBH to explain or predict tree yield. Provide an interpretation of the slope.
d. Determine and interpret the coefficient of determination.
e. Determine and interpret the standard error of the estimate. Explain how you could graphically sanity check your value for the standard error of the estimate.
f. Use your regression equation to predict the yield of a blackbutt tree with a CBH of 380 centimeters. Explain why this prediction might be problematic.
g. Briefly describe each of the LINE assumptions associated with performing a hypothesis test on the existence of a linear relationship. Test using a=5% whether the apparent linear relationship between CBH and Yield can be explained by chance and be careful to clearly state both your decision and your conclusion.
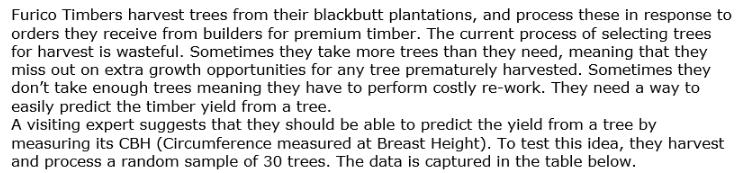
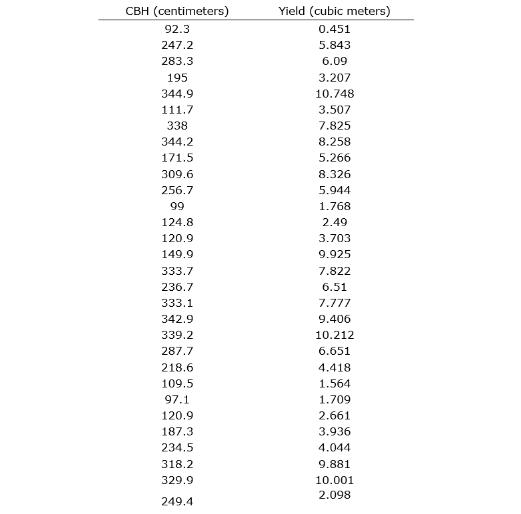
Furico Timbers harvest trees from their blackbutt plantations, and process these in response to orders they receive from builders for premium timber. The current process of selecting trees for harvest is wasteful. Sometimes they take more trees than they need, meaning that they miss out on extra growth opportunities for any tree prematurely harvested. Sometimes they don't take enough trees meaning they have to perform costly re-work. They need a way to easily predict the timber yield from a tree. A visiting expert suggests that they should be able to predict the yield from a tree by measuring its CBH (Circumference measured at Breast Height). To test this idea, they harvest and process a random sample of 30 trees. The data is captured in the table below.
Step by Step Solution
3.33 Rating (162 Votes )
There are 3 Steps involved in it
Furico Timbers Timber Yield Prediction Part a Scattergram with Trendline Chart Title Scattergram of Tree Yield vs CBH for Furico Timbers Xaxis Label C... View full answer

Get step-by-step solutions from verified subject matter experts