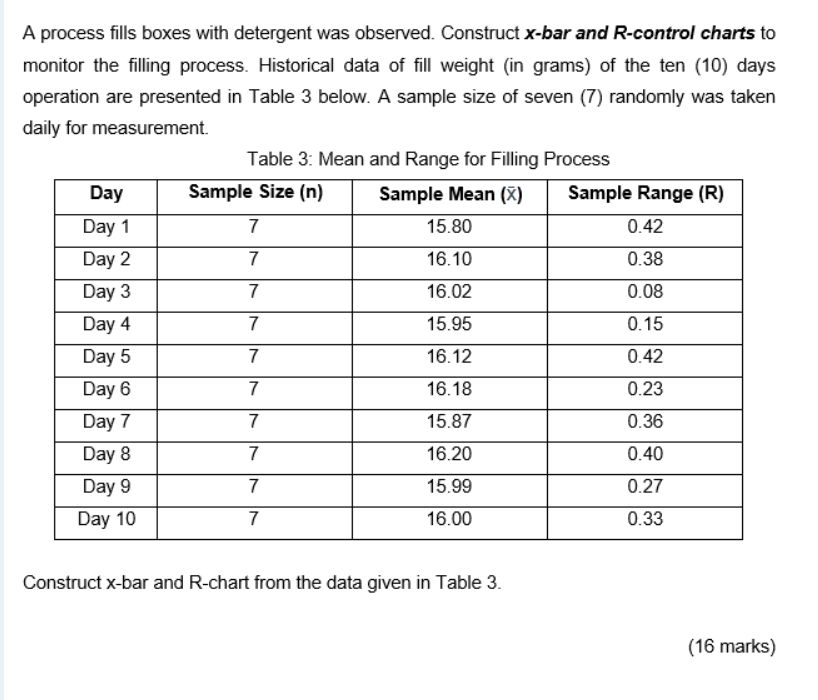
Question: A process fills boxes with detergent was observed. Construct x-bar and R-control charts to monitor the filling process. Historical data of fill weight (in grams)

A process fills boxes with detergent was

A process fills boxes with detergent was observed. Construct x-bar and R-control charts to monitor the filling process. Historical data of fill weight (in grams) of the ten (10) days operation are presented in Table 3 below. A sample size of seven (7) randomly was taken daily for measurement. Table 3: Mean and Range for Filling Process Day Sample Size (n) Sample Mean (7) Sample Range (R) Day 1 7 15.80 0.42 Day 2 7 16.10 0.38 Day 3 7 16.02 0.08 Day 4 7 15.95 0.15 Day 5 7 16.12 0.42 Day 6 7 16.18 0.23 Day 7 7 15.87 0.36 Day 8 7 16.20 0.40 Day 9 7 15.99 0.27 Day 10 7 16.00 0.33 Construct x-bar and R-chart from the data given in Table 3. (16 marks)

Step by Step Solution

There are 3 Steps involved in it

1 Expert Approved Answer
Step: 1 Unlock blur-text-image
Question Has Been Solved by an Expert!

Get step-by-step solutions from verified subject matter experts

Step: 2 Unlock
Step: 3 Unlock

Students Have Also Explored These Related General Management Questions!