

Question: Question 7. A Procter and Gamble factory process fills boxes with detergent. Construct an appropriate set of control charts to monitor the process. Historical data
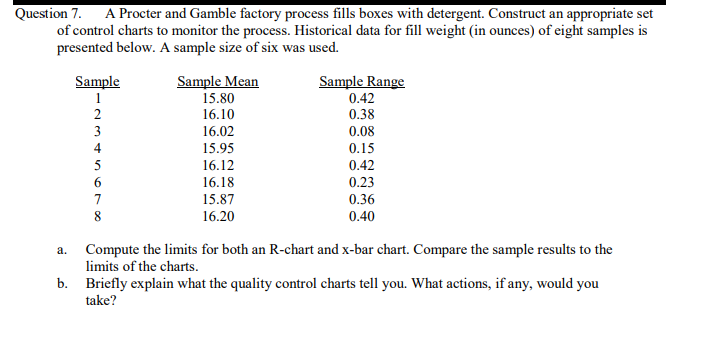
Question 7. A Procter and Gamble factory process fills boxes with detergent. Construct an appropriate set of control charts to monitor the process. Historical data for fill weight (in ounces) of eight samples is presented below. A sample size of six was used. a. Compute the limits for both an R-chart and x-bar chart. Compare the sample results to the limits of the charts. b. Briefly explain what the quality control charts tell you. What actions, if any, would you take
Step by Step Solution
There are 3 Steps involved in it
1 Expert Approved Answer
Step: 1 Unlock

Question Has Been Solved by an Expert!
Get step-by-step solutions from verified subject matter experts
Step: 2 Unlock
Step: 3 Unlock