Question: A process flow map for the passenger security process at one terminal of a medium sized airport is given below. The process works as follows.
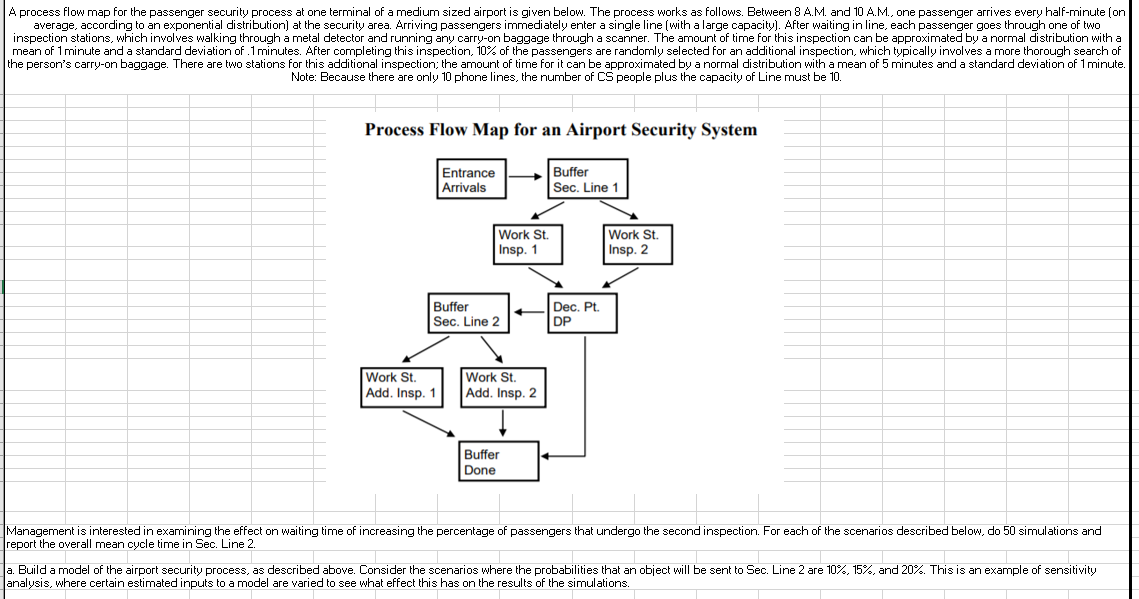
A process flow map for the passenger security process at one terminal of a medium sized airport is given below. The process works as follows. Between 8 A.M. and 10 A.M., one passenger arrives every half-minute (on average, according to an exponential distribution) at the security area. Arriving passengers immediately enter a single line (with a large capacity). After waiting in line, each passenger goes through one of two inspection stations, which involves walking through a metal detector and running any carry-on baggage through a scanner. The amount of time for this inspection can be approximated by a normal distribution with a mean of 1 minute and a standard deviation of 1 minutes. After completing this inspection, 10% of the passengers are randomly selected for an additional inspection, which typically involves a more thorough search of the person's carry-on baggage. There are two stations for this additional inspection; the amount of time for it can be approximated by a normal distribution with a mean of 5 minutes and a standard deviation of 1 minute. Note: Because there are only 10 phone lines, the number of CS people plus the capacity of Line must be 10. Process Flow Map for an Airport Security System Entrance Buffer Sec. Line 1 Arrivals Work St. Work St. Insp. 2 Insp. 1 Buffer Sec. Line 2 Dec. Pt. DP Work St. Add. Insp. Work St. Add. Insp. 2 Buffer Done Management is interested in examining the effect on waiting time of increasing the percentage of passengers that undergo the second inspection. For each of the scenarios described below, do 50 simulations and report the overall mean cycle time in Sec. Line 2. a. Build a model of the airport security process, as described above. Consider the scenarios where the probabilities that an object will be sent to Sec. Line 2 are 10%, 15%, and 20%. This is an example of sensitivity analysis, where certain estimated inputs to a model are varied to see what effect this has on the results of the simulations. A process flow map for the passenger security process at one terminal of a medium sized airport is given below. The process works as follows. Between 8 A.M. and 10 A.M., one passenger arrives every half-minute (on average, according to an exponential distribution) at the security area. Arriving passengers immediately enter a single line (with a large capacity). After waiting in line, each passenger goes through one of two inspection stations, which involves walking through a metal detector and running any carry-on baggage through a scanner. The amount of time for this inspection can be approximated by a normal distribution with a mean of 1 minute and a standard deviation of 1 minutes. After completing this inspection, 10% of the passengers are randomly selected for an additional inspection, which typically involves a more thorough search of the person's carry-on baggage. There are two stations for this additional inspection; the amount of time for it can be approximated by a normal distribution with a mean of 5 minutes and a standard deviation of 1 minute. Note: Because there are only 10 phone lines, the number of CS people plus the capacity of Line must be 10. Process Flow Map for an Airport Security System Entrance Buffer Sec. Line 1 Arrivals Work St. Work St. Insp. 2 Insp. 1 Buffer Sec. Line 2 Dec. Pt. DP Work St. Add. Insp. Work St. Add. Insp. 2 Buffer Done Management is interested in examining the effect on waiting time of increasing the percentage of passengers that undergo the second inspection. For each of the scenarios described below, do 50 simulations and report the overall mean cycle time in Sec. Line 2. a. Build a model of the airport security process, as described above. Consider the scenarios where the probabilities that an object will be sent to Sec. Line 2 are 10%, 15%, and 20%. This is an example of sensitivity analysis, where certain estimated inputs to a model are varied to see what effect this has on the results of the simulations


