

Question: A process is monitored by taking the means of sample measurements every week. These weekly mean values are then plotted versus time to obtain the
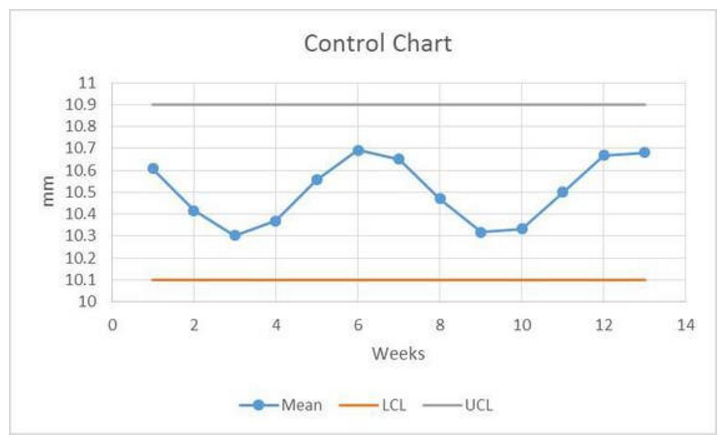
A process is monitored by taking the means of sample measurements every week. These weekly mean values are then plotted versus time to obtain the following graph. The specification limits are not visible on the graph because they are outside of the control limits. Which of the following is true?
A) The process is incapable, but in control
B) The process is capable, but out of control
C) The process is capable and in control
D) The process is incapable and out of control
Control Chart 11 mm 10.9 10.8 10.7 10.6 10.5 10.4 10.3 10.2 10.1 10 0 2 4. 10 12 14 6. 8 Weeks -Mean -LCL UCLStep by Step Solution
There are 3 Steps involved in it
1 Expert Approved Answer
Step: 1 Unlock

Question Has Been Solved by an Expert!
Get step-by-step solutions from verified subject matter experts
Step: 2 Unlock
Step: 3 Unlock