

Question: A process is monitored by taking the means of sample measurements every week. These weekly mean values are then plotted versus time to obtain this
A process is monitored by taking the means of sample measurements every week. These weekly mean values are then plotted versus time to obtain this graph: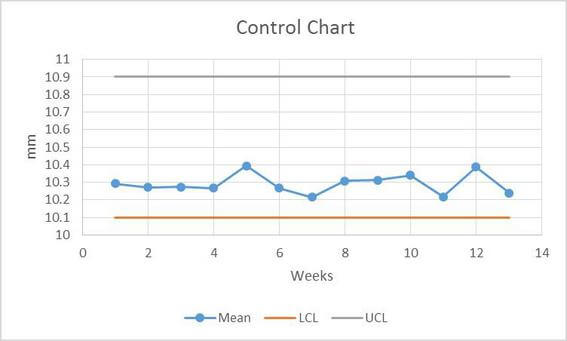
Assume that the specification limits are outside the control limits. Which of the following statements is TRUE of the process?
- A.
The process is capable and in control.
- B.
The process is capable but out of control.
- C.
The process is incapable and out of control.
- D.
The process is incapable but in control.
Step by Step Solution
There are 3 Steps involved in it
1 Expert Approved Answer
Step: 1 Unlock

Question Has Been Solved by an Expert!
Get step-by-step solutions from verified subject matter experts
Step: 2 Unlock
Step: 3 Unlock