

Question: A process (Process #28) is under study to be controlled using control limits and X and R charts. samples is also provided. Samples from process
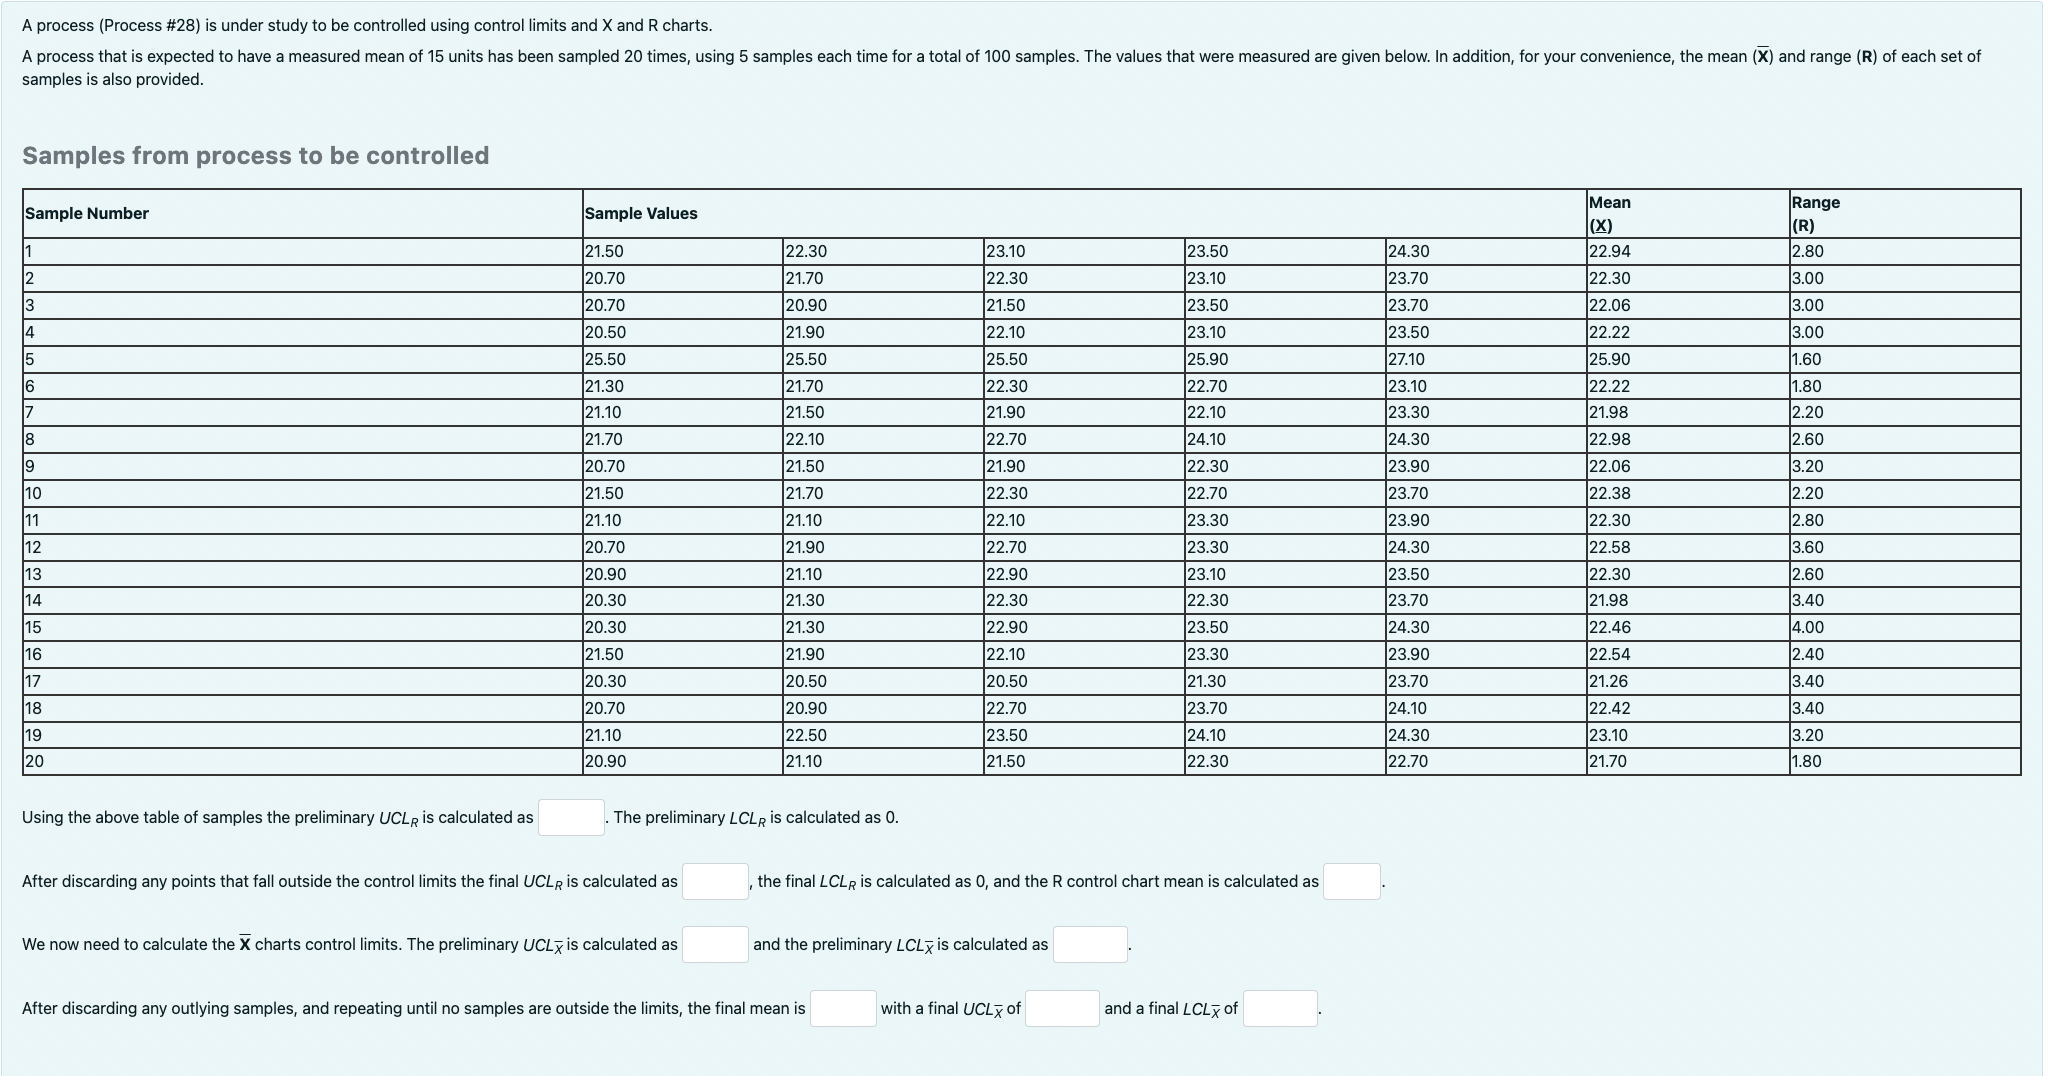
A process (Process \#28) is under study to be controlled using control limits and X and R charts. samples is also provided. Samples from process to be controlled Cammla Nlumbar Cammla talino Mean Range Using the above table of samples the preliminary UCLR is calculated as The preliminary LCLR is calculated as 0 . After discarding any points that fall outside the control limits the final UCLR is calculated as the final LCLR is calculated as 0 , and the R control chart mean is calculated as We now need to calculate the X charts control limits. The preliminary UCLx is calculated as and the preliminary LCLx is calculated as After discarding any outlying samples, and repeating until no samples are outside the limits, the final mean is with a final UCLx of and a final LCLx of
Step by Step Solution
There are 3 Steps involved in it

Get step-by-step solutions from verified subject matter experts