

Question: A production process for the JMF Semicon is monitored using x-bar and R charts. 10 samples of n=15 observations have been gathered with the following
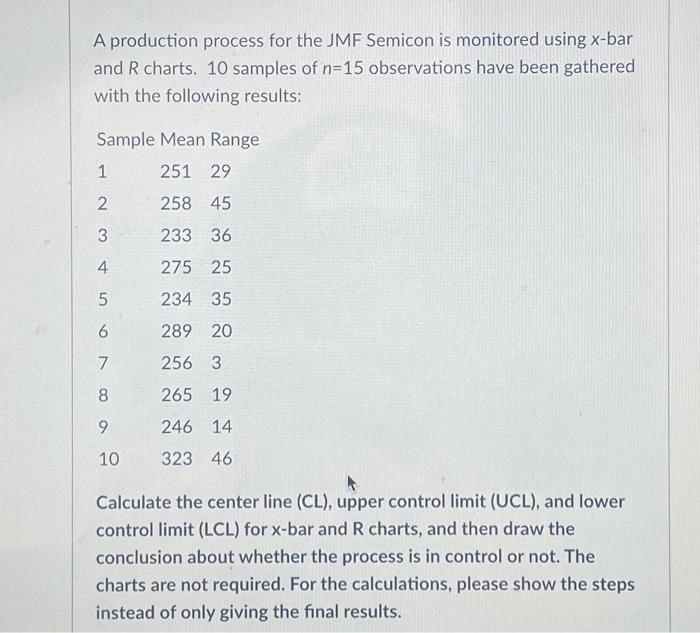
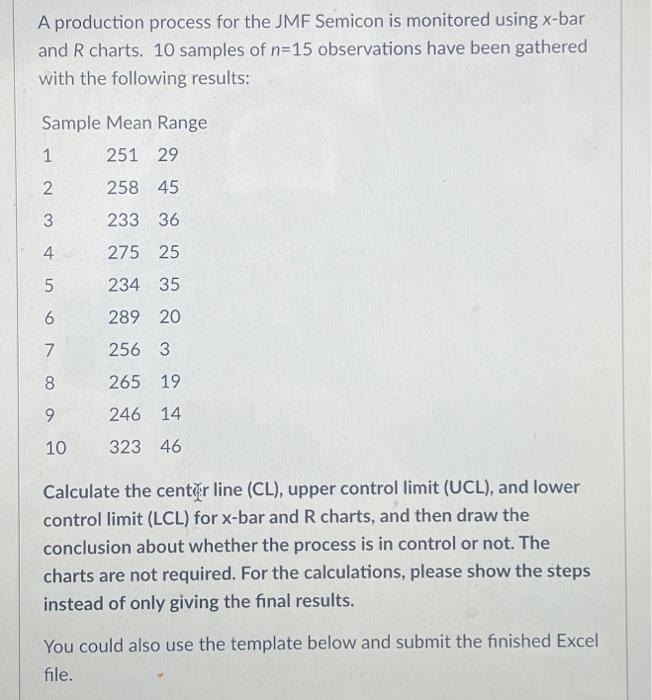
A production process for the JMF Semicon is monitored using x-bar and R charts. 10 samples of n=15 observations have been gathered with the following results: Calculate the center line (CL), upper control limit (UCL), and lower control limit ( LCL ) for x-bar and R charts, and then draw the conclusion about whether the process is in control or not. The charts are not required. For the calculations, please show the steps instead of only giving the final results. A production process for the JMF Semicon is monitored using x-bar and R charts. 10 samples of n=15 observations have been gathered with the following results: Calculate the center r line (CL), upper control limit (UCL), and lower control limit (LCL) for x-bar and R charts, and then draw the conclusion about whether the process is in control or not. The charts are not required. For the calculations, please show the steps instead of only giving the final results. You could also use the template below and submit the finished Excel file
Step by Step Solution
There are 3 Steps involved in it

Get step-by-step solutions from verified subject matter experts