

Question: A production process for the JMF Semicon is monitored using control charts. Ten samples of 15 observations have been gathered with the following results
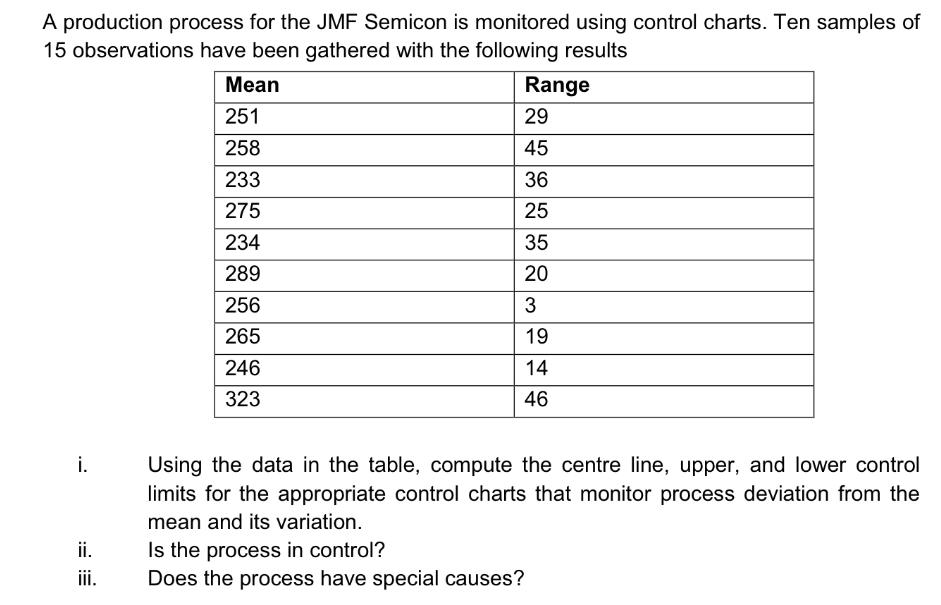
A production process for the JMF Semicon is monitored using control charts. Ten samples of 15 observations have been gathered with the following results Mean 251 Range 29 258 45 233 36 275 25 234 35 289 20 256 3 265 19 246 14 323 46 i. ii. iii. Using the data in the table, compute the centre line, upper, and lower control limits for the appropriate control charts that monitor process deviation from the mean and its variation. Is the process in control? Does the process have special causes?
Step by Step Solution
There are 3 Steps involved in it
1 Expert Approved Answer
Step: 1 Unlock

Question Has Been Solved by an Expert!
Get step-by-step solutions from verified subject matter experts
Step: 2 Unlock
Step: 3 Unlock