

Question: a quality analyst construct a control chart for defending whether four machines all producing the same product are in control with regard to particular quality
a quality analyst construct a control chart for defending whether four machines all producing the same product are in control with regard to particular quality atribuye accordingly she inspected 1000 units of output from each machine in dndome samples with the following results what are the control chart upper and lower control limits for 95% confidence level? 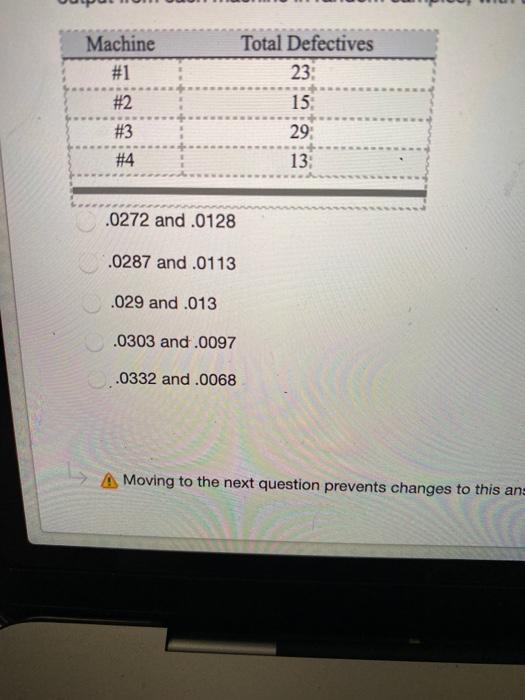
Machine #1 Total Defectives 23 15 29 #2 #3 #4 13 .0272 and .0128 .0287 and .0113 .029 and .013 .0303 and .0097 0.0332 and .0068 A Moving to the next question prevents changes to this an
Step by Step Solution
There are 3 Steps involved in it
1 Expert Approved Answer
Step: 1 Unlock

Question Has Been Solved by an Expert!
Get step-by-step solutions from verified subject matter experts
Step: 2 Unlock
Step: 3 Unlock