

Question: question below A Quality:r Analyst wants to construct a control chart for determining whether three machines, all producing the same product, are under control with
question below
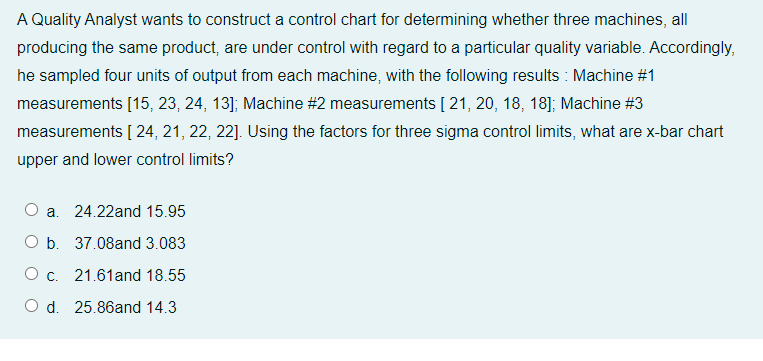
A Quality:r Analyst wants to construct a control chart for determining whether three machines, all producing the same product, are under control with regard to a particular dualityr variable. Accordingly, he sampled four units of output from each machine. with the following results : Machine #1 measurements [15, 23. 24, 13]; Machine #2 measurements [ 21, 20, 18, 18]; Machine #3 measurements [ 24: 21, 22, 22]. Using the factors for three sigma control limits: what are xhar chart upper and lower control limits? C) a. 24.22and 15.95 C) b. SIDE-and 3.333 O c. 21.61and 18.55 C) d. 25.35am 14.3
Step by Step Solution
There are 3 Steps involved in it
1 Expert Approved Answer
Step: 1 Unlock

Question Has Been Solved by an Expert!
Get step-by-step solutions from verified subject matter experts
Step: 2 Unlock
Step: 3 Unlock