

Question: A quality analyst wants to construct a control chart for determining whether four machines, all producing the same product, are in control with regard to
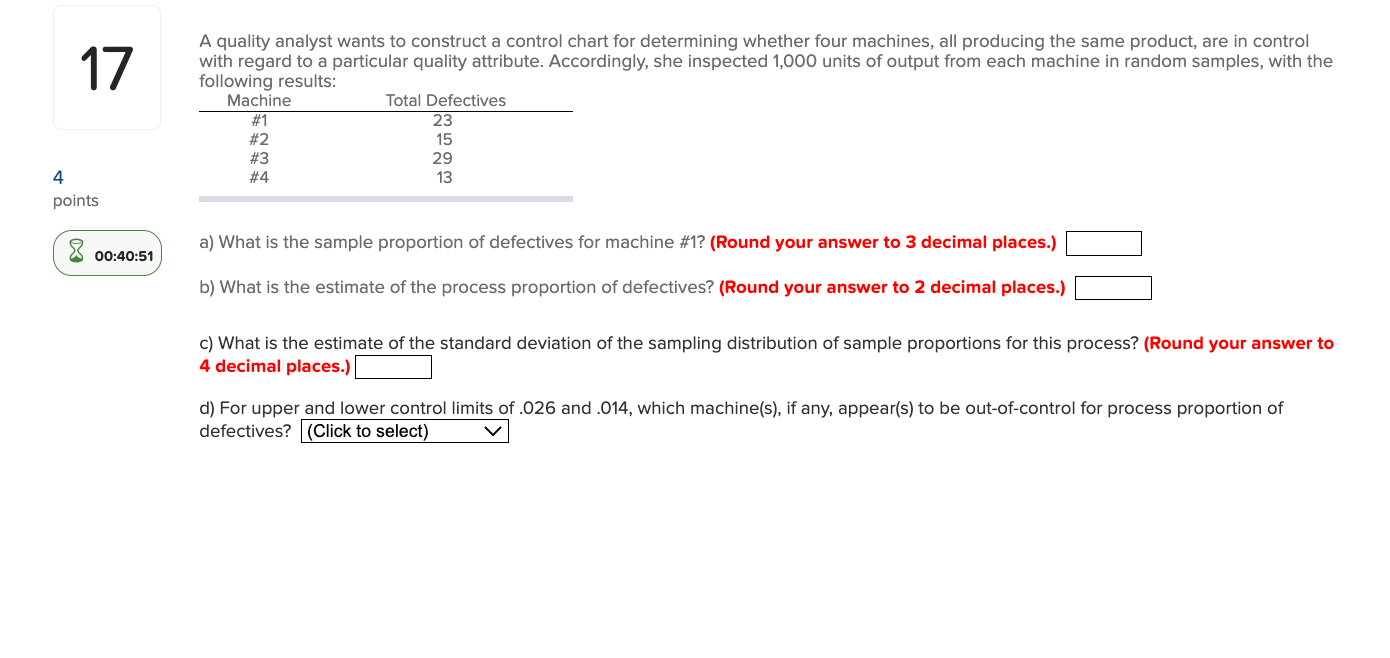
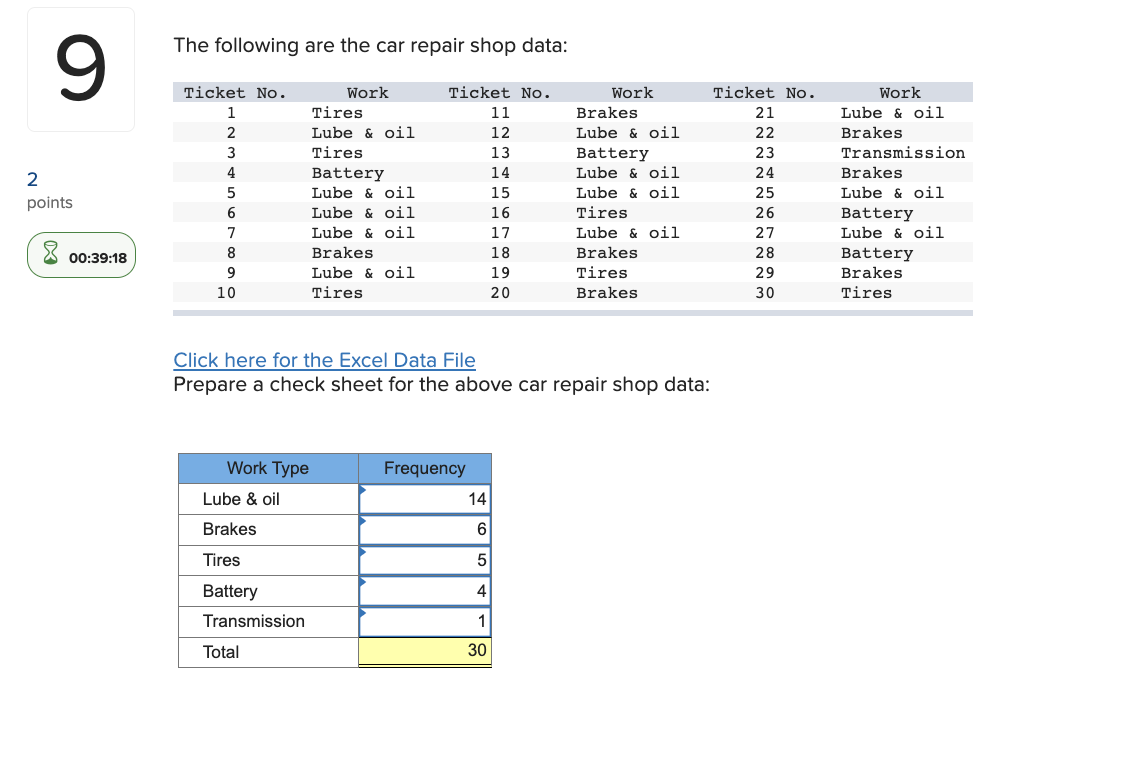
A quality analyst wants to construct a control chart for determining whether four machines, all producing the same product, are in control with regard to a particular quality attribute. Accordingly, she inspected 1,000 units of output from each machine in random samples, with the fallnisine racilte. a) What is the sample proportion of defectives for machine \#1? (Round your answer to 3 decimal places.) b) What is the estimate of the process proportion of defectives? (Round your answer to 2 decimal places.) c) What is the estimate of the standard deviation of the sampling distribution of sample proportions for this process? (Round your answer to 4 decimal places.) d) For upper and lower control limits of .026 and .014, which machine(s), if any, appear(s) to be out-of-control for process proportion of defectives? The following are the car repair shop data: Click here for the Excel Data File Prepare a check sheet for the above car repair shop data
Step by Step Solution
There are 3 Steps involved in it

Get step-by-step solutions from verified subject matter experts