

Question: A quality analyst wants to construct a control chart for determining whether three machines, all producing the same product, are in control with regard to
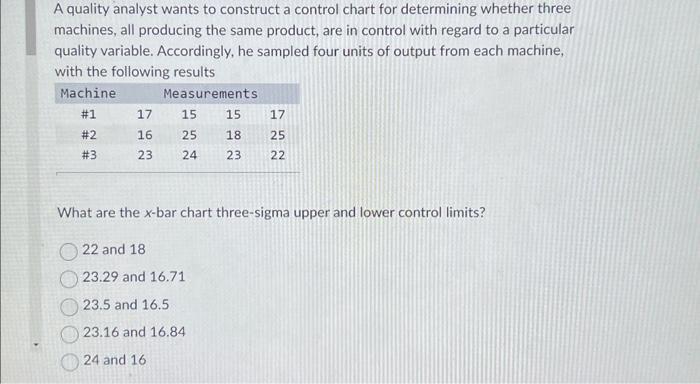
A quality analyst wants to construct a control chart for determining whether three machines, all producing the same product, are in control with regard to a particular quality variable. Accordingly, he sampled four units of output from each machine, with the following results What are the x-bar chart three-sigma upper and lower control limits? 22 and 18 23.29 and 16.71 23.5 and 16.5 23.16 and 16.84 24 and 16
Step by Step Solution
There are 3 Steps involved in it
1 Expert Approved Answer
Step: 1 Unlock

Question Has Been Solved by an Expert!
Get step-by-step solutions from verified subject matter experts
Step: 2 Unlock
Step: 3 Unlock