

Question: A quality analyst wants to construct a sample mean chart for controlling a packaging process. Each day last week, he randomly selected four packages and
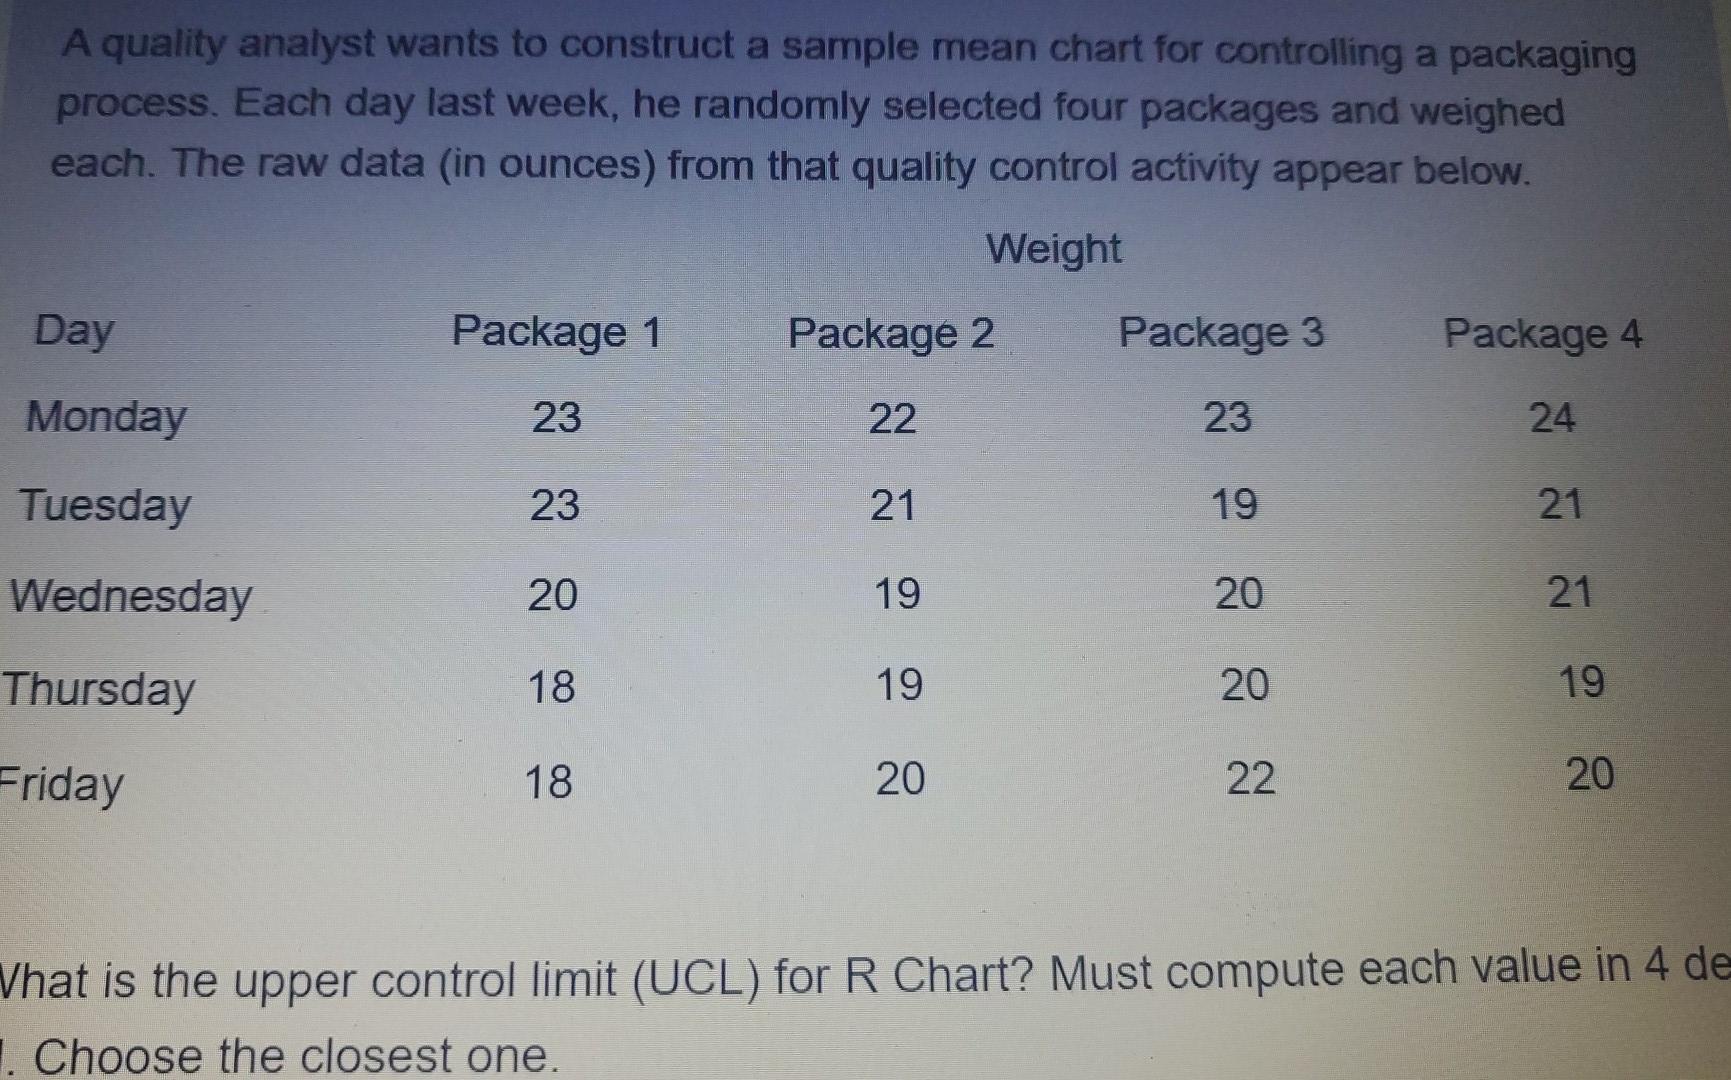
A quality analyst wants to construct a sample mean chart for controlling a packaging process. Each day last week, he randomly selected four packages and weighed each. The raw data (in ounces) from that quality control activity appear below. Weight Day Package 1 Package 2 Package 3 Package 4 Monday 23 22 23 24 Tuesday 23 21 19 21 Wednesday 20 19 20 21 Thursday 18 19 20 19 Friday 18 20 22 20 Vhat is the upper control limit (UCL) for R Chart? Must compute each value in 4 de 1. Choose the closest one
Step by Step Solution
There are 3 Steps involved in it
1 Expert Approved Answer
Step: 1 Unlock

Question Has Been Solved by an Expert!
Get step-by-step solutions from verified subject matter experts
Step: 2 Unlock
Step: 3 Unlock