

Question: A quality analyst wants to construct a sample mean chart for controlling a packaging process. He knows from past experience that whenever this process is
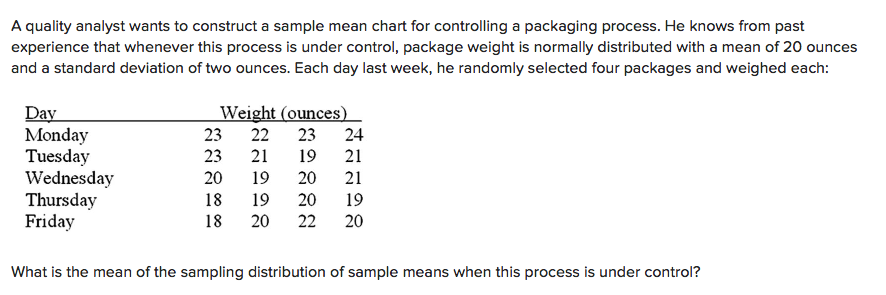
A quality analyst wants to construct a sample mean chart for controlling a packaging process. He knows from past experience that whenever this process is under control, package weight is normally distributed with a mean of 20 ounces and a standard deviation of two ounces. Each day last week, he randomly selected four packages and weighed each: Weight (ounces) 23 22 23 24 21 20 19 20 21 23 21 Day Monday Tuesday Wednesday Thursday Friday 19 18 19 20 19 18 20 22 20 What is the mean of the sampling distribution of sample means when this process is under control? 18 ounces 19 ounces 20 ounces 21 ounces 22 ounces
Step by Step Solution
There are 3 Steps involved in it
1 Expert Approved Answer
Step: 1 Unlock

Question Has Been Solved by an Expert!
Get step-by-step solutions from verified subject matter experts
Step: 2 Unlock
Step: 3 Unlock