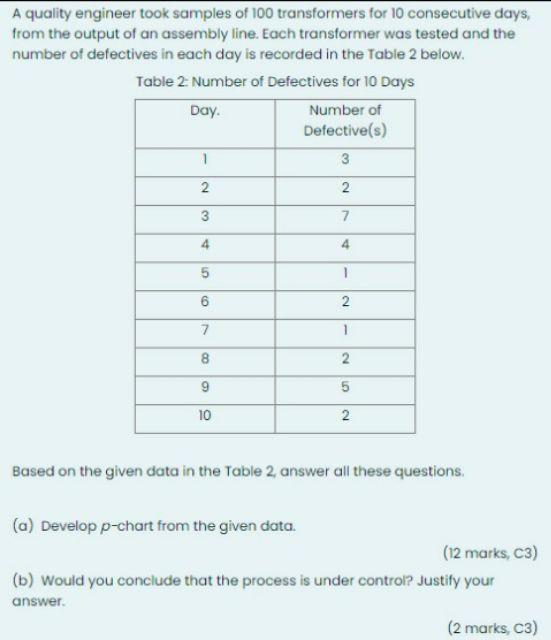
Question: A quality engineer took samples of 100 transformers for 10 consecutive days, from the output of an assembly line. Each transformer was tested and the

A quality engineer took samples of 100

A quality engineer took samples of 100 transformers for 10 consecutive days, from the output of an assembly line. Each transformer was tested and the number of defectives in each day is recorded in the Table 2 below. Table 2 Number of Defectives for 10 Days Day. Number of Defective(s) 1 3 2 N 3 7 4 4 5 1 09 2 7 1 8 2. 9 5 5 10 2. Based on the given data in the Table 2 answer all these questions, (a) Develop p-chart from the given data. (12 marks, C3) (b) Would you conclude that the process is under control? Justify your answer (2 marks, C3)

Step by Step Solution

There are 3 Steps involved in it

1 Expert Approved Answer
Step: 1 Unlock blur-text-image
Question Has Been Solved by an Expert!

Get step-by-step solutions from verified subject matter experts

Step: 2 Unlock
Step: 3 Unlock

Students Have Also Explored These Related General Management Questions!