

Question: Consider the reliability diagram shown below. To develop maintainability and reliability figures for the each of the three subsystems in the diagram (A, B and
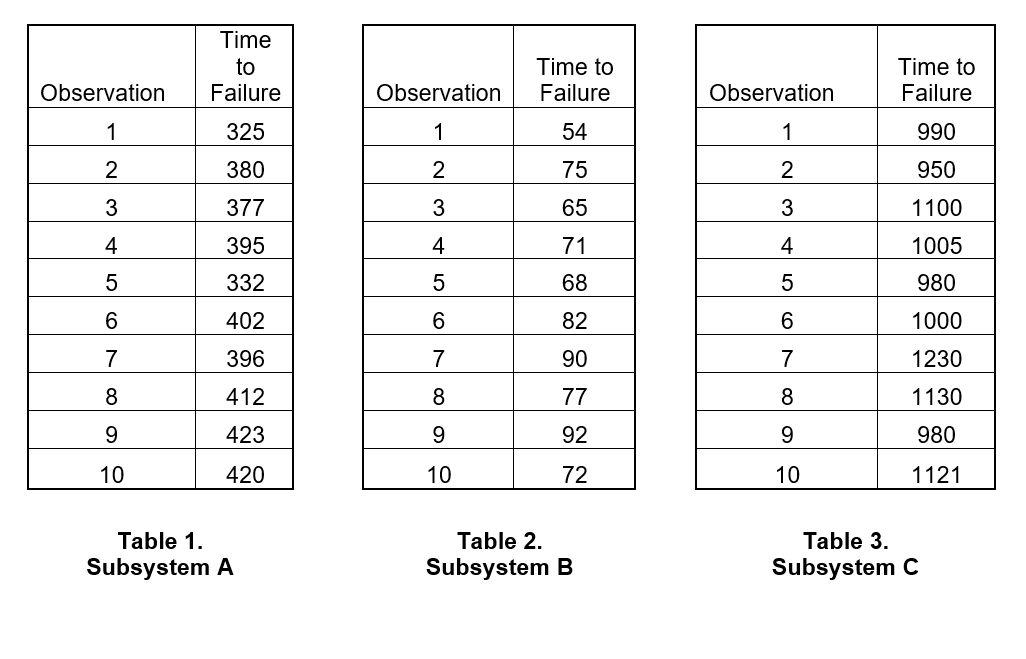
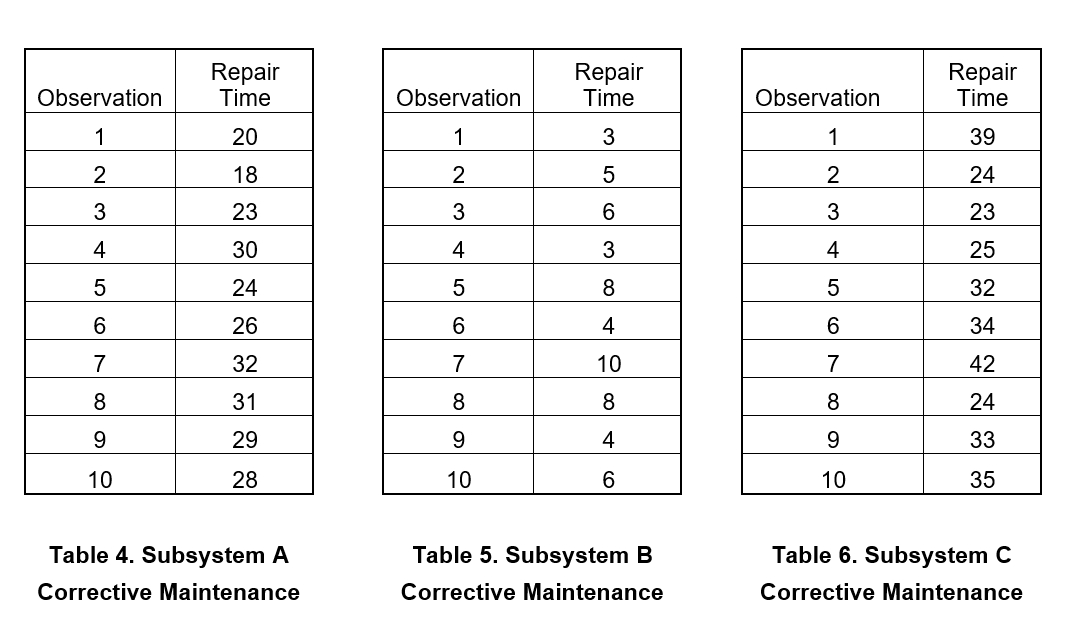
Consider the reliability diagram shown below. To develop maintainability and reliability figures for the each of the three subsystems in the diagram (A, B and C) and the system, you have collected historical data (10 observations per subsystem) on the time to failure, in hours, for each of the subsystems. The data for subsystems A, B and C are shown in Tables 1 through 6, respectively.
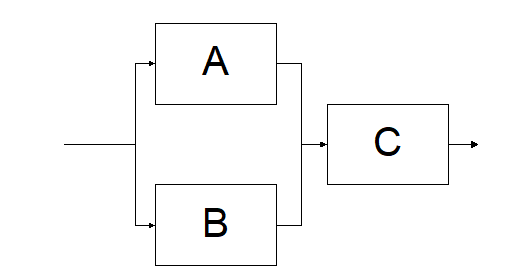
- Plot R(t) for the system, over the time period t=0 hours to t=1000 hours, in 50 hour increments.
- What is the probability that the system will experience 2 or fewer failures over 100 hours?
- Given a 26 week time period in which you operate the system for 10 hours a day, 7 days a week, what is the minimum spares complement needed in order to achieve a 95% level of confidence of having a spare on hand for subsystem A? Please take your results to the nearest percent.
Step by Step Solution
There are 3 Steps involved in it
1 Expert Approved Answer
Step: 1 Unlock

Question Has Been Solved by an Expert!
Get step-by-step solutions from verified subject matter experts
Step: 2 Unlock
Step: 3 Unlock