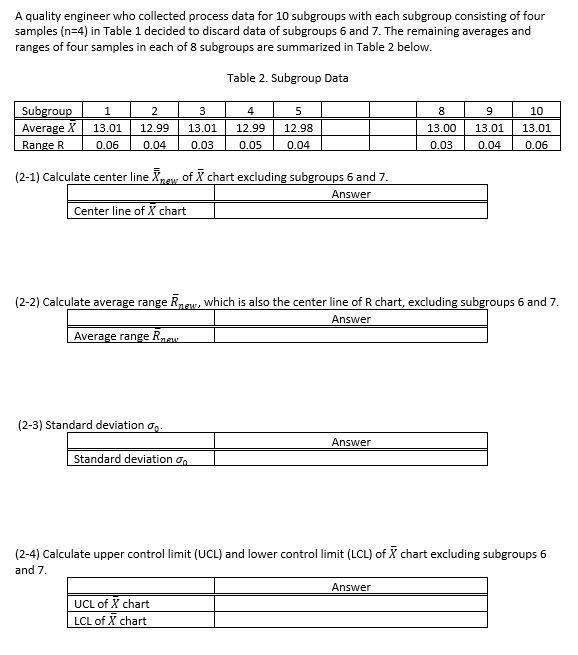
Question: A quality engineer who collected process data for 10 subgroups with each subgroup consisting of four samples (n=4) in Table 1 decided to discard data

A quality engineer who collected process data forA quality engineer who collected process data forA quality engineer who collected process data for

A quality engineer who collected process data for 10 subgroups with each subgroup consisting of four samples (n=4) in Table 1 decided to discard data of subgroups 6 and 7. The remaining averages and ranges of four samples in each of 8 subgroups are summarized in Table 2 below. Table 2. Subgroup Data 3 4 8 9 Subgroup Average X Range R 1 13.01 0.06 2 12.99 0.04 13.01 0.03 12.99 0.05 5 12.98 0.04 13.00 0.03 13.01 0.04 10 13.01 0.06 (2-1) Calculate center line news of # chart excluding subgroups 6 and 7. Answer Center line of X chart (2-2) Calculate average range Rnew, which is also the center line of chart, excluding subgroups 6 and 7. Answer Average range Raw (2-3) Standard deviation on Answer Standard deviation Go (2-4) Calculate upper controllimit (UCL) and lower controllimit (LCL) of chart excluding subgroups 6 and 7. Answer UCL of X chart LCL of X chart (2-5) Create X chart with center line, UCL, and LCL, and plot subgroup data in the below figure (do not plot data for subgroup 6 and 7). Clearly label center line, UCL, and LCL. verage dnouns 13.05 13.04 13.03 13.02 13.01 13.00 12.99 12.90 12.97 12.95 12.95 12.94 12.93 12.92 12.91 12.90 3 4 7 B 9 10 5 6 Subgroup (2-6) Answer questions in the below table on this process based on subgroup averages in i chart excluding subgroups 6 and 7. Answer Is this process in control in terms of subgroup averages? Yes or No Briefly explain reason of your above answer Explain Do you suspect that there are variations due to common causes? Yes or No Briefly explain reason of your above Explain answer Do you suspect that there are variations due to assignable causes? Yes or No Briefly explain reason of your above answer Explain (2-7) Calculate upper control limit (UCL) and lower control limit (LCL) of R chart excluding subgroups 6 and 7. Answer UCL of R chart LCL of R chart (2-8) Create R chart with center line, UCL, and LCL, and plot subgroup data in the below figure (do not plot data for subgroup 6 and 7). Clearly label center line, UCL, and LCL. 0.16 0.15 0.14 0.13 Subgroup range 0.12 0.11 0.10 0.09 0.08 0.07 0.05 0.05 0.04 0.03 0.02 0.01 0 1 NE 3 4 7 9 10 5 6 Subgroup

Step by Step Solution

There are 3 Steps involved in it

1 Expert Approved Answer
Step: 1 Unlock blur-text-image
Question Has Been Solved by an Expert!

Get step-by-step solutions from verified subject matter experts

Step: 2 Unlock
Step: 3 Unlock

Students Have Also Explored These Related General Management Questions!