

Question: A quality engineer who collected process data for 10 subgroups with each subgroup consisting of three samples (n=3) in Table 3 decided to discard data
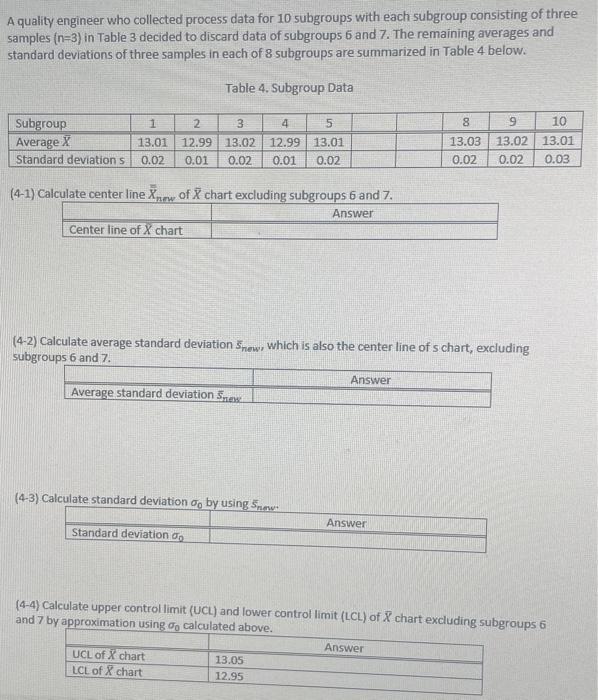
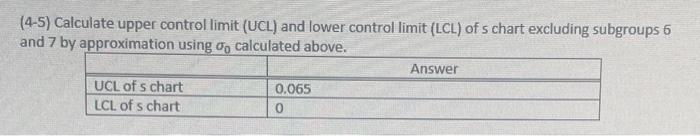
A quality engineer who collected process data for 10 subgroups with each subgroup consisting of three samples (n=3) in Table 3 decided to discard data of subgroups 6 and 7 . The remaining averages and standard deviations of three samples in each of 8 subgroups are summarized in Table 4 below. Table 4. Subgroup Data (4-1) Calculate center line Xnow of X chart excludine subgroups 6 and 7. (4-2) Calculate average standard deviation snew, which is also the center line of s chart, excluding subgroups 6 and 7. (4-3) Calculate standard deviation n bv usina e (4-4) Calculate upper control limit (UCL) and lower control limit (LCL) of X chart excluding subgroups 6 and 7 by approximation using n calculated ahmou (4-5) Calculate upper control limit (UCL) and lower control limit (LCL) of 5 chart excluding subgroups 6 and 7 by approximation using n calculated above
Step by Step Solution
There are 3 Steps involved in it

Get step-by-step solutions from verified subject matter experts