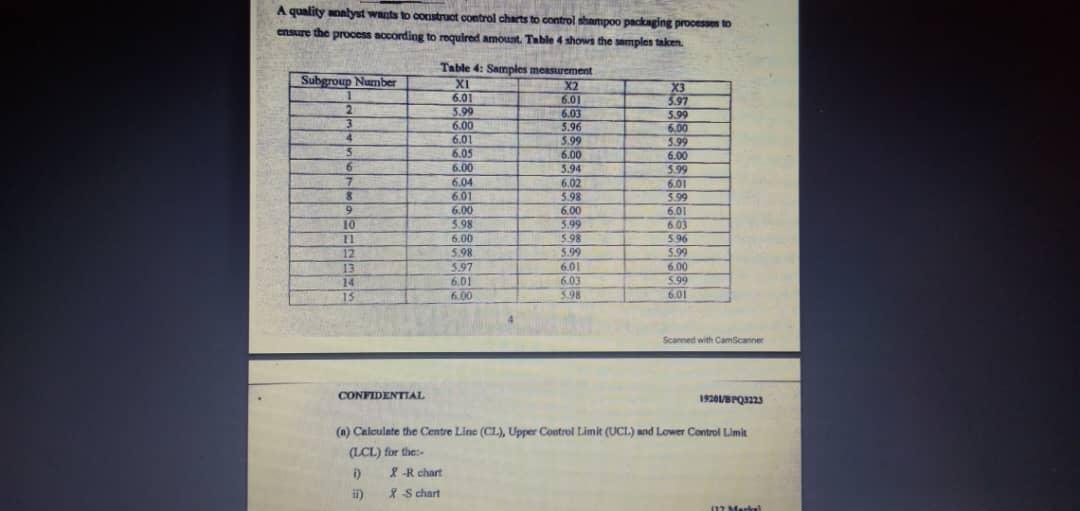
Question: A quality manlyst wants to construct control charts to control shampoo packaging processes to maskare the process according to required amount. Table 4 shows the

A quality manlyst wants to construct control

A quality manlyst wants to construct control charts to control shampoo packaging processes to maskare the process according to required amount. Table 4 shows the samples taken. Table 4: Samples mesurement Subgroup Number Xi X2 1 6.01 6.01 597 2 5.99 6.03 5.99 3 600 5.96 6.00 4 6.01 5.99 5.99 5 6.05 6.00 6.00 6 6 6.00 3.94 3.99 7 6.04 6,02 601 8 6.01 3.98 5.99 6.00 6.00 6.01 10 398 599 6.03 11 6.00 598 596 12 5.98 5.99 5.99 13 3.97 6.01 6.00 6.01 6.03 5.99 15 6.00 3.98 16.01 Scanned with CamScanner CONFIDENTIAL 19201801223 (a) Calculate the Centre Line (CI), Upper Control Limit (UCL) and Lower Control Limit (LCL) for the D) P-R chart - 11) XS chart

Step by Step Solution

There are 3 Steps involved in it

1 Expert Approved Answer
Step: 1 Unlock blur-text-image
Question Has Been Solved by an Expert!

Get step-by-step solutions from verified subject matter experts

Step: 2 Unlock
Step: 3 Unlock

Students Have Also Explored These Related General Management Questions!