

Question: A regression model has been developed to analyze the relationship between a response variable Y and an explanatory variable X. A prediction interval is to
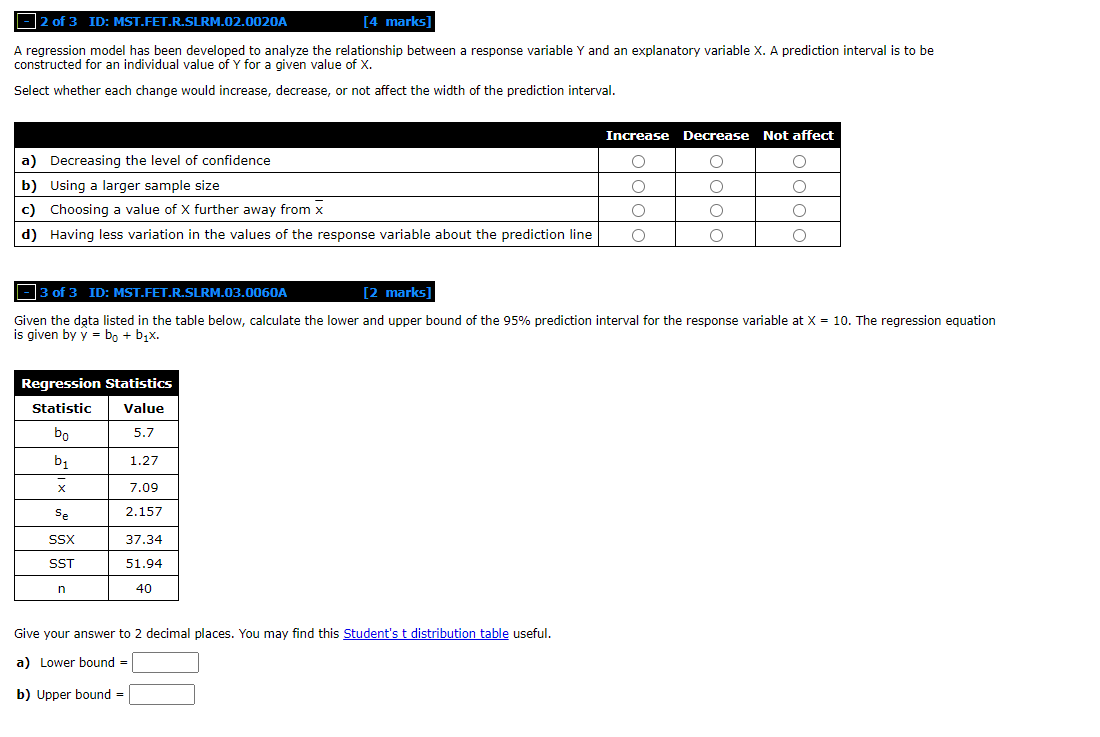
A regression model has been developed to analyze the relationship between a response variable Y and an explanatory variable X. A prediction interval is to be constructed for an individual value 01\"! for a given value of X. Select whether each change would increase, decrease, or not affect the width of the prediction interval. Increase Decrease Not affect a) Decreasing the level of condence 0 O O b) Using a larger sample size :2} Choosing a value of X further awayr from ; GOO 000 000 d) Having less variation in the values of the response variable about the prediction line Given the data listed in the table below, calculate the lower and upper bound of the 95% prediction interval for the response variable at X = 10. The regression equation is given by y = b0 + blx. Regression Statistics Statistic Value b0 5.? b1 1.27 7.09 5a 2.15:' SSX 37.34 SST 51.94 h 40 Give your answer to 2 decimal places You may nd this Student's t distribution table useful. a] Lower bound = \\:| b) Upper bound = \\:|
Step by Step Solution
There are 3 Steps involved in it

Get step-by-step solutions from verified subject matter experts