

Question: A researcher used stepwise regression to create regression models to predict BirthRate (births per 1,000) using five predictors: LifeExp (life expectancy in years), InfMort
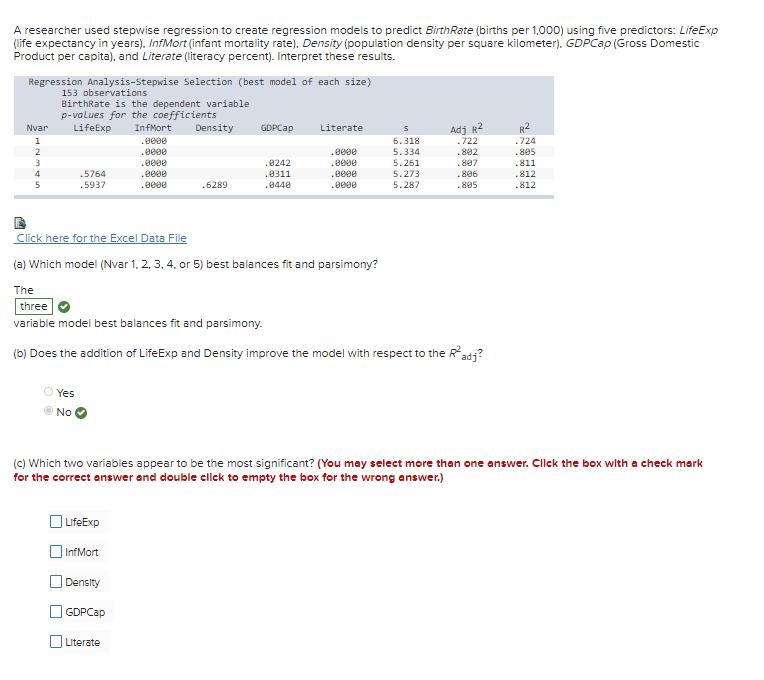
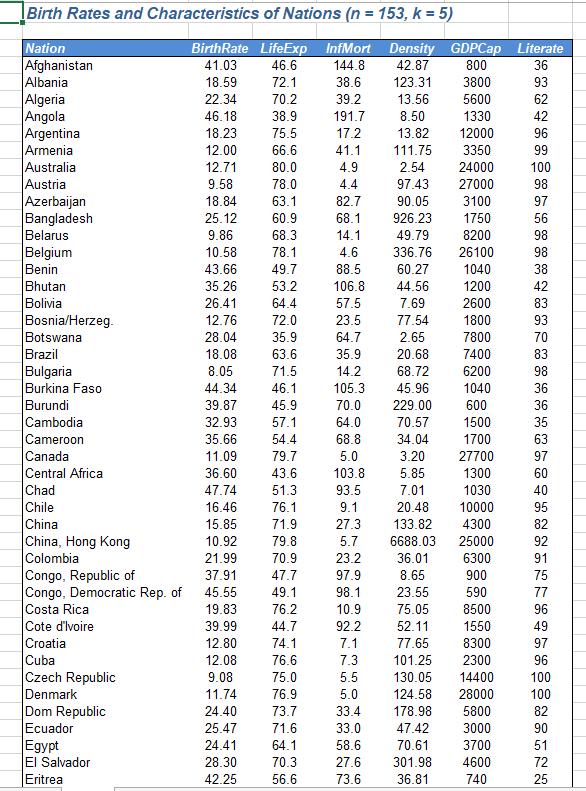
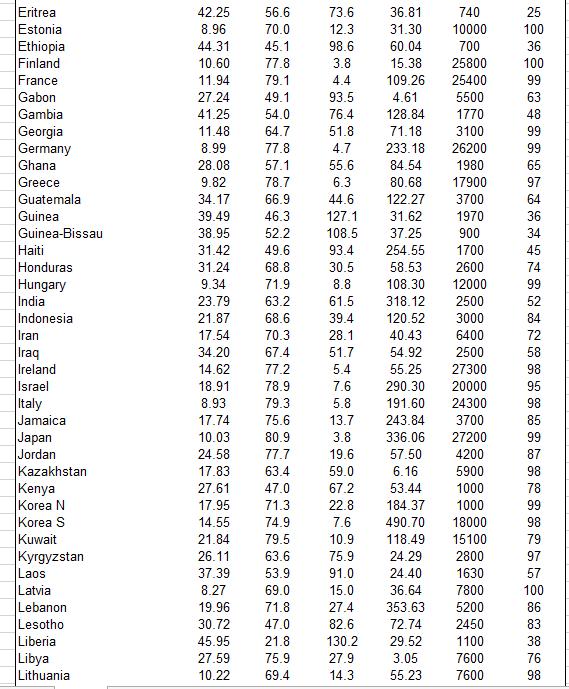
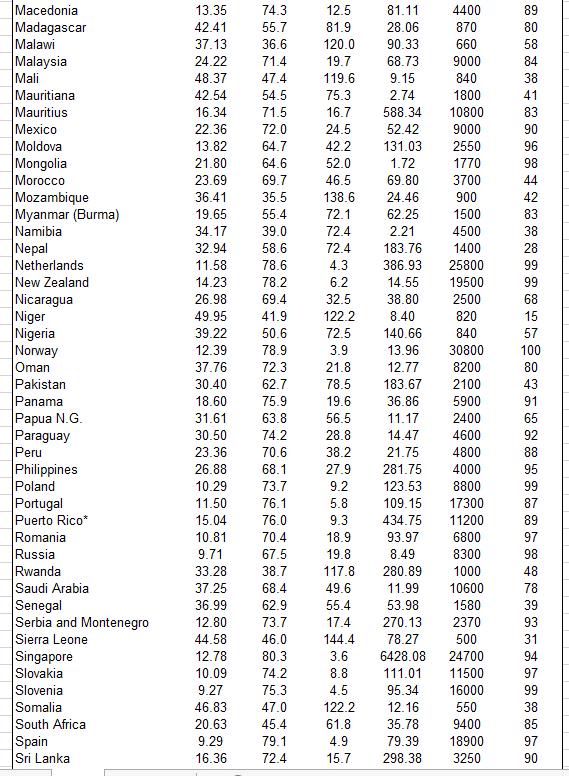
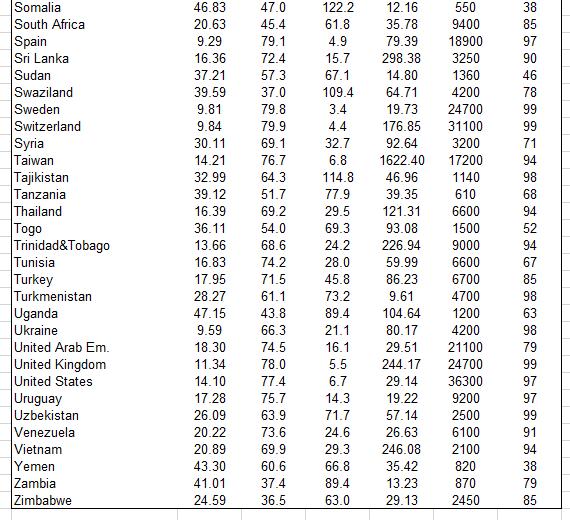
A researcher used stepwise regression to create regression models to predict BirthRate (births per 1,000) using five predictors: LifeExp (life expectancy in years), InfMort (infant mortality rate). Density (population density per square kilometer). GDPCap (Gross Domestic Product per capita), and Literate (literacy percent). Interpret these results. Regression Analysis-Stepwise Selection (best model of each size) 153 observations BirthRate is the dependent variable p-values for the coefficients LifeExp Adj R2 .722 Nvar InfMort Density GDPCap Literate R2 6.318 .724 eeee 5.334 .802 .805 .0000 .eeee .0242 5.261 .807 .811 .5764 .9311 5.273 5.287 .806 .812 5 .5937 .6289 .8440 .895 .812 Click here for the Excel Data File (a) Which model (Nvar 1, 2, 3. 4. or 5) best balances fit and parsimony? The three variable model best balances fit and parsimony. (b) Does the addition of LifeExp and Density improve the model with respect to the R adj? O Yes No (c) Which two variables appear to be the most significant? (You may select more than one answer. Clck the box with a check mark for the correct answer and double cllck to empty the box for the wrong answer.) O uifeExp InfMort Density GDPCap Literate Birth Rates and Characteristics of Nations (n = 153, k = 5) Nation BirthRate LifeExp InfMort 46.6 Density GDPCap Literate 41.03 Afghanistan Albania Algeria Angola Argentina Armenia 144.8 42.87 800 36 18.59 72.1 38.6 39.2 123.31 3800 93 13.56 8.50 22.34 70.2 5600 62 46.18 38.9 191.7 1330 42 18.23 75.5 17.2 13.82 12000 96 12.00 66.6 41.1 111.75 3350 99 Australia 12.71 80.0 4.9 2.54 24000 100 Austria 9.58 78.0 4.4 97.43 27000 98 Azerbaijan Bangladesh 18.84 63.1 82.7 90.05 3100 97 25.12 60.9 68.1 926.23 1750 56 Belarus 9.86 68.3 14.1 49.79 8200 98 Belgium 10.58 78.1 4.6 336.76 26100 98 49.7 53.2 Benin 43.66 88.5 60.27 1040 38 Bhutan 35.26 106.8 44.56 1200 42 26.41 7.69 77.54 2.65 20.68 Bolivia 64.4 57.5 2600 83 Bosnia/Herzeg. 12.76 72.0 23.5 1800 93 Botswana 28.04 35.9 64.7 7800 70 Brazil Bulgaria Burkina Faso 18.08 63.6 35.9 7400 83 8.05 71.5 14.2 68.72 6200 98 44.34 46.1 105.3 45.96 1040 36 Burundi 39.87 45.9 70.0 229.00 600 36 64.0 68.8 Cambodia 32.93 57.1 70.57 1500 35 Cameroon 35.66 54.4 34.04 1700 63 Canada 11.09 79.7 5.0 3.20 27700 97 Central Africa 36.60 43.6 103.8 5.85 1300 60 Chad 47.74 51.3 93.5 7.01 1030 40 Chile 16.46 76.1 9.1 20.48 10000 95 China 15.85 71.9 27.3 133.82 4300 82 China, Hong Kong Colombia 10.92 79.8 5.7 6688.03 25000 92 21.99 70.9 23.2 36.01 6300 91 Congo, Republic of Congo, Democratic Rep. of Costa Rica Cote d'Ivoire 37.91 47.7 97.9 8.65 900 75 45.55 49.1 98.1 23.55 590 77 10.9 92.2 19.83 76.2 75.05 8500 96 39.99 44.7 52.11 1550 49 Croatia 12.80 74. 7.1 77.65 8300 97 Cuba 12.08 76.6 7.3 101.25 2300 96 Czech Republic 9.08 75.0 5.5 130.05 14400 100 Denmark 11.74 76.9 5.0 124.58 28000 100 Dom Republic 24.40 73.7 33.4 178.98 5800 82 Ecuador 25.47 71.6 33.0 47.42 3000 90 Egypt El Salvador 58.6 27.6 24.41 64.1 70.61 3700 51 28.30 70.3 301.98 4600 72 Eritrea 42.25 56.6 73.6 36.81 740 25 Eritrea 42.25 56.6 73.6 36.81 740 25 Estonia 8.96 70.0 12.3 31.30 10000 100 Ethiopia 44.31 45.1 98.6 60.04 700 36 Finland 10.60 77.8 3.8 15.38 25800 100 France 11.94 79.1 4.4 109.26 25400 99 27.24 41.25 49.1 54.0 Gabon 93.5 4.61 5500 63 Gambia 76.4 128.84 1770 48 51.8 71.18 Georgia Germany 11.48 64.7 3100 99 8.99 28.08 77.8 4.7 233.18 26200 99 1980 17900 Ghana 57.1 55.6 84.54 65 Greece 9.82 78.7 6.3 80.68 97 Guatemala 34.17 66.9 44.6 122.27 3700 64 Guinea 39.49 46.3 127.1 31.62 1970 36 Guinea-Bissau 38.95 52.2 108.5 37.25 900 34 Haiti 31.42 49.6 93.4 254.55 1700 45 Honduras 31.24 68.8 30.5 58.53 2600 74 Hungary 9.34 71.9 8.8 108.30 12000 99 India 23.79 63.2 61.5 318.12 2500 52 Indonesia 21.87 68.6 39.4 120.52 3000 84 Iran 17.54 70.3 28.1 40.43 6400 72 Iraq Ireland 34.20 67.4 51.7 54.92 2500 58 14.62 77.2 5.4 55.25 27300 98 Israel 18.91 78.9 7.6 290.30 20000 95 Italy Jamaica Japan Jordan 8.93 79.3 5.8 191.60 24300 98 17.74 75.6 13.7 243.84 3700 85 10.03 80.9 3.8 336.06 27200 99 4200 5900 24.58 77.7 19.6 57.50 87 Kazakhstan 17.83 63.4 59.0 6.16 98 47.0 Kenya Korea N Korea S 27.61 67.2 53.44 1000 78 17.95 71.3 22.8 184.37 1000 99 14.55 74.9 7.6 490.70 18000 98 Kuwait 21.84 79.5 10.9 118.49 15100 79 Kyrgyzstan Laos 26.11 63.6 75.9 24.29 2800 97 37.39 53.9 91.0 24.40 1630 57 Latvia Lebanon Lesotho Liberia Libya Lithuania 8.27 69.0 15.0 36.64 7800 100 19.96 71.8 27.4 353.63 5200 86 30.72 47.0 82.6 130.2 72.74 2450 83 45.95 21.8 29.52 1100 38 27.59 75.9 27.9 3.05 7600 76 10.22 69.4 14.3 55.23 7600 98 Macedonia 13.35 74.3 12.5 81.11 4400 89 Madagascar 42.41 55.7 81.9 28.06 870 80 36.6 71.4 Malawi 37.13 120.0 90.33 660 58 Malaysia 24.22 19.7 68.73 9000 84 Mali 48.37 47.4 119.6 9.15 840 38 Mauritiana 42.54 54.5 75.3 2.74 1800 41 Mauritius 16.34 71.5 16.7 588.34 10800 83 Mexico 22.36 72.0 24.5 52.42 9000 90 Moldova Mongolia Morocco 13.82 64.7 42.2 131.03 2550 96 21.80 64.6 52.0 1.72 1770 98 23.69 36.41 69.7 46.5 69.80 3700 44 Mozambique 35.5 138.6 24.46 900 42 Myanmar (Burma) Namibia 19.65 55.4 72.1 62.25 1500 83 34.17 39.0 72.4 2.21 4500 38 Nepal 32.94 58.6 72.4 183.76 1400 28 Netherlands 11.58 78.6 4.3 386.93 25800 99 New Zealand Nicaragua Niger Nigeria Norway Oman 14.23 78.2 6.2 14.55 19500 99 26.98 69.4 32.5 38.80 2500 68 49.95 41.9 122.2 8.40 820 15 39.22 50.6 72.5 140.66 840 57 12.39 78.9 3.9 13.96 30800 100 37.76 72.3 21.8 12.77 8200 80 Pakistan 30.40 62.7 78.5 183.67 2100 43 Panama 18.60 75.9 19.6 36.86 5900 91 Papua N.G. Paraguay Peru 31.61 63.8 56.5 11.17 2400 65 30.50 74.2 28.8 14.47 4600 92 23.36 70.6 38.2 21.75 4800 88 26.88 Philippines Poland 68.1 27.9 281.75 4000 95 10.29 73.7 9.2 123.53 8800 99 Portugal Puerto Rico* 11.50 76.1 5.8 109.15 17300 87 15.04 76.0 9.3 434.75 11200 89 Romania 10.81 70.4 18.9 93.97 6800 97 Russia 9.71 67.5 19.8 8.49 8300 98 Rwanda Saudi Arabia Senegal Serbia and Montenegro Sierra Leone Singapore 33.28 38.7 117.8 280.89 1000 48 37.25 68.4 49.6 11.99 10600 78 36.99 62.9 55.4 53.98 1580 39 12.80 44.58 73.7 17.4 270.13 2370 93 46.0 144.4 78.27 500 31 12.78 80.3 3.6 6428.08 24700 94 Slovakia 10.09 74.2 8.8 111.01 11500 97 Slovenia 9.27 75.3 4.5 95.34 16000 99 Somalia 46.83 47.0 122.2 12.16 550 38 South Africa Spain Sri Lanka 20.63 45.4 61.8 35.78 9400 85 9.29 79.1 4.9 79.39 18900 97 16.36 72.4 15.7 298.38 3250 90 Somalia 46.83 47.0 122.2 12.16 550 38 South Africa Spain Sri Lanka 20.63 45.4 61.8 35.78 9400 85 9.29 79.1 72.4 4.9 79.39 18900 97 16.36 15.7 298.38 3250 1360 90 Sudan 37.21 57.3 67.1 14.80 46 Swaziland 39.59 37.0 109.4 64.71 4200 78 Sweden 9.81 79.8 3.4 19.73 24700 99 Switzerland 9.84 79.9 4.4 176.85 31100 99 69.1 92.64 3200 Syria Taiwan Tajikistan Tanzania 30.11 32.7 71 14.21 76.7 6.8 1622.40 17200 94 32.99 64.3 114.8 46.96 1140 98 39.12 51.7 77.9 39.35 610 68 Thailand 16.39 69.2 29.5 121.31 6600 94 Togo Trinidad&Tobago 36.11 54.0 69.3 93.08 1500 52 13.66 68.6 24.2 226.94 9000 94 Tunisia 16.83 74.2 28.0 59.99 6600 6700 67 Turkey Turkmenistan Uganda 17.95 71.5 45.8 86.23 85 28.27 61.1 73.2 9.61 4700 1200 98 47.15 43.8 89.4 104.64 63 Ukraine 9.59 66.3 21.1 80.17 4200 98 United Arab Em. United Kingdom United States Uruguay 18.30 74.5 16.1 29.51 21100 79 11.34 78.0 5.5 244.17 24700 99 14.10 77.4 6.7 29.14 36300 97 17.28 75.7 14.3 19.22 9200 97 57.14 26.63 Uzbekistan 26.09 63.9 71.7 2500 99 Venezuela Vietnam 20.22 73.6 24.6 6100 91 20.89 69.9 29.3 246.08 2100 94 Yemen Zambia Zimbabwe 66.8 89.4 43.30 60.6 35.42 820 38 41.01 37.4 13.23 870 79 24.59 36.5 63.0 29.13 2450 85
Step by Step Solution
3.38 Rating (142 Votes )
There are 3 Steps involved in it
Solution From the given information The 4 variable models best balances fit and parsimony 4 ... View full answer

Get step-by-step solutions from verified subject matter experts