

Question: A researcher wanted to use hypothesis testing to support the claim that mean hours worked per week in retail stores has dropped from five years
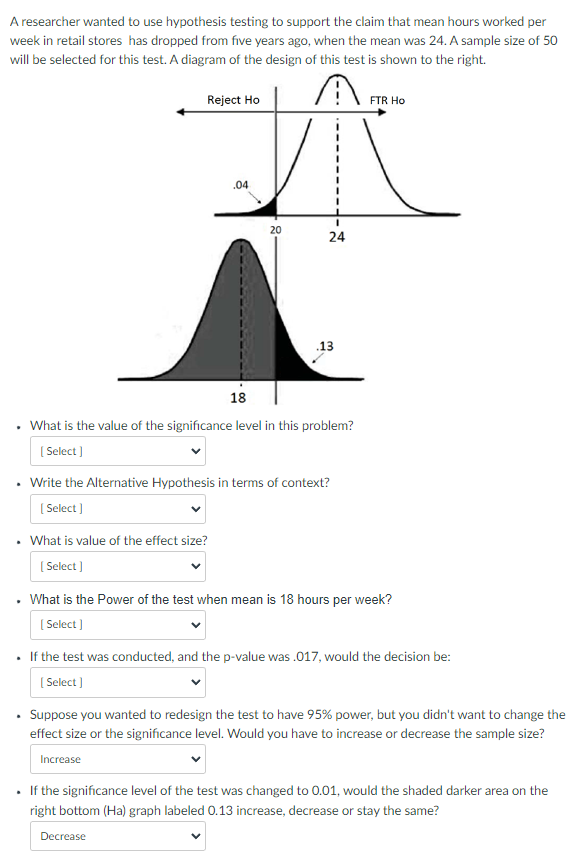
A researcher wanted to use hypothesis testing to support the claim that mean hours worked per week in retail stores has dropped from five years ago, when the mean was 24. A sample size of 50 will be selected for this test. A diagram of the design of this test is shown to the right. Reject Ho FTR Ho 04 20 24 .13 18 . What is the value of the significance level in this problem? [ Select ] Write the Alternative Hypothesis in terms of context? [ Select ] What is value of the effect size? [ Select ] What is the Power of the test when mean is 18 hours per week? [ Select ] If the test was conducted, and the p-value was .017, would the decision be: [ Select ] Suppose you wanted to redesign the test to have 95% power, but you didn't want to change the effect size or the significance level. Would you have to increase or decrease the sample size? Increase If the significance level of the test was changed to 0.01, would the shaded darker area on the right bottom (Ha) graph labeled 0.13 increase, decrease or stay the same? Decrease
Step by Step Solution
There are 3 Steps involved in it

Get step-by-step solutions from verified subject matter experts