

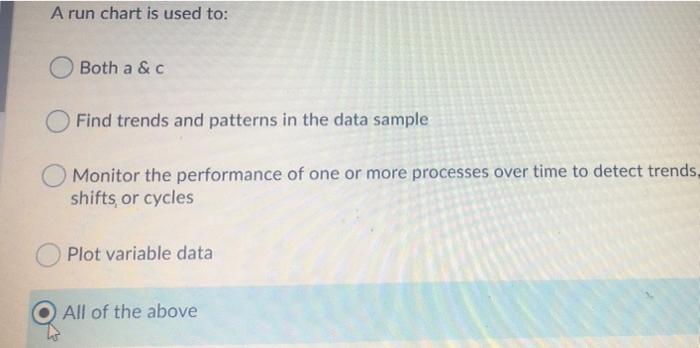
Question: A run chart is used to: Both a &c Find trends and patterns in the data sample Monitor the performance of one or more processes
Step by Step Solution
There are 3 Steps involved in it
1 Expert Approved Answer
Step: 1 Unlock

Question Has Been Solved by an Expert!
Get step-by-step solutions from verified subject matter experts
Step: 2 Unlock
Step: 3 Unlock