

Question: a) Run the following template script. Comment each line to see if you understand what the program histogram2.py is doing import numpy as np import
a) Run the following template script. Comment each line to see if you understand what the program histogram2.py is doing import numpy as np import matplotlib.pyplot as plt import matplotlib.mlab as mlab from random import gauss, randrange, seed from scipy.stats import norm # Generating random sequence of gaussian random numbers mu, sigma = 100, 15 #Generating random sequence N=10000 x=[] for k in range(N): x.append(gauss(mu,sigma)) # the histogram of the data num_bins = 40 n, bins, patches = plt.hist(x, num_bins, normed=1, edgecolor='black', alpha=0.75) # best fit of data (mu_fit, sigma_fit) = norm.fit(x) # add a 'best fit' line y = mlab.normpdf( bins, mu, sigma) # Option bins takes take values num_bin because of the hist() function y = mlab.normpdf( bins, mu_fit, sigma_fit) plt.plot(bins, y, 'r--', lw=2) #plot options and plot plt.xlabel('x') plt.ylabel('p(x)') plt.title(r'Fitting pdf to Histogram: $mu$=%0.3f, $sigma$=%0.3f' %(mu_fit, sigma_fit)) plt.axis([40, 160, 0, 0.03]) plt.grid(True) plt.show()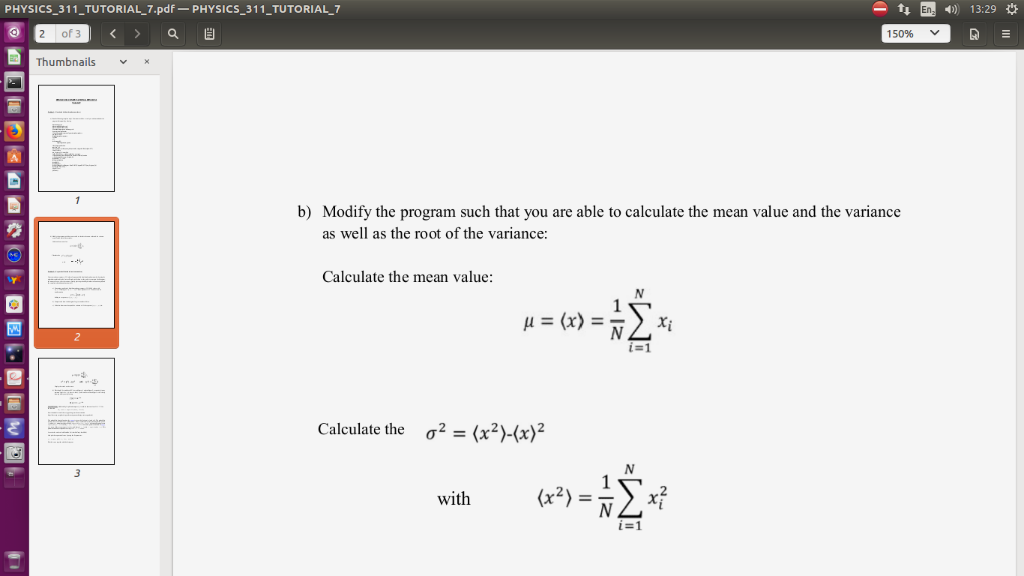
PHYSICS_311_TUTORIAL 7.pdf-PHYSICS_311 TUTORIAL7 ti En)13:29 2 of 3 150% Thumbnailsx b) Modify the program such that you are able to calculate the mean value and the variance as well as the root of the variance: Calculate the mean value: 2 Calculate the 2=(x2)-(x)2 2 with 1=1
Step by Step Solution
There are 3 Steps involved in it

Get step-by-step solutions from verified subject matter experts