

Question: A sample containing years to maturity and yield (%) for 40 corporate bonds are contained in the table below. Company Ticker GE Years Yield
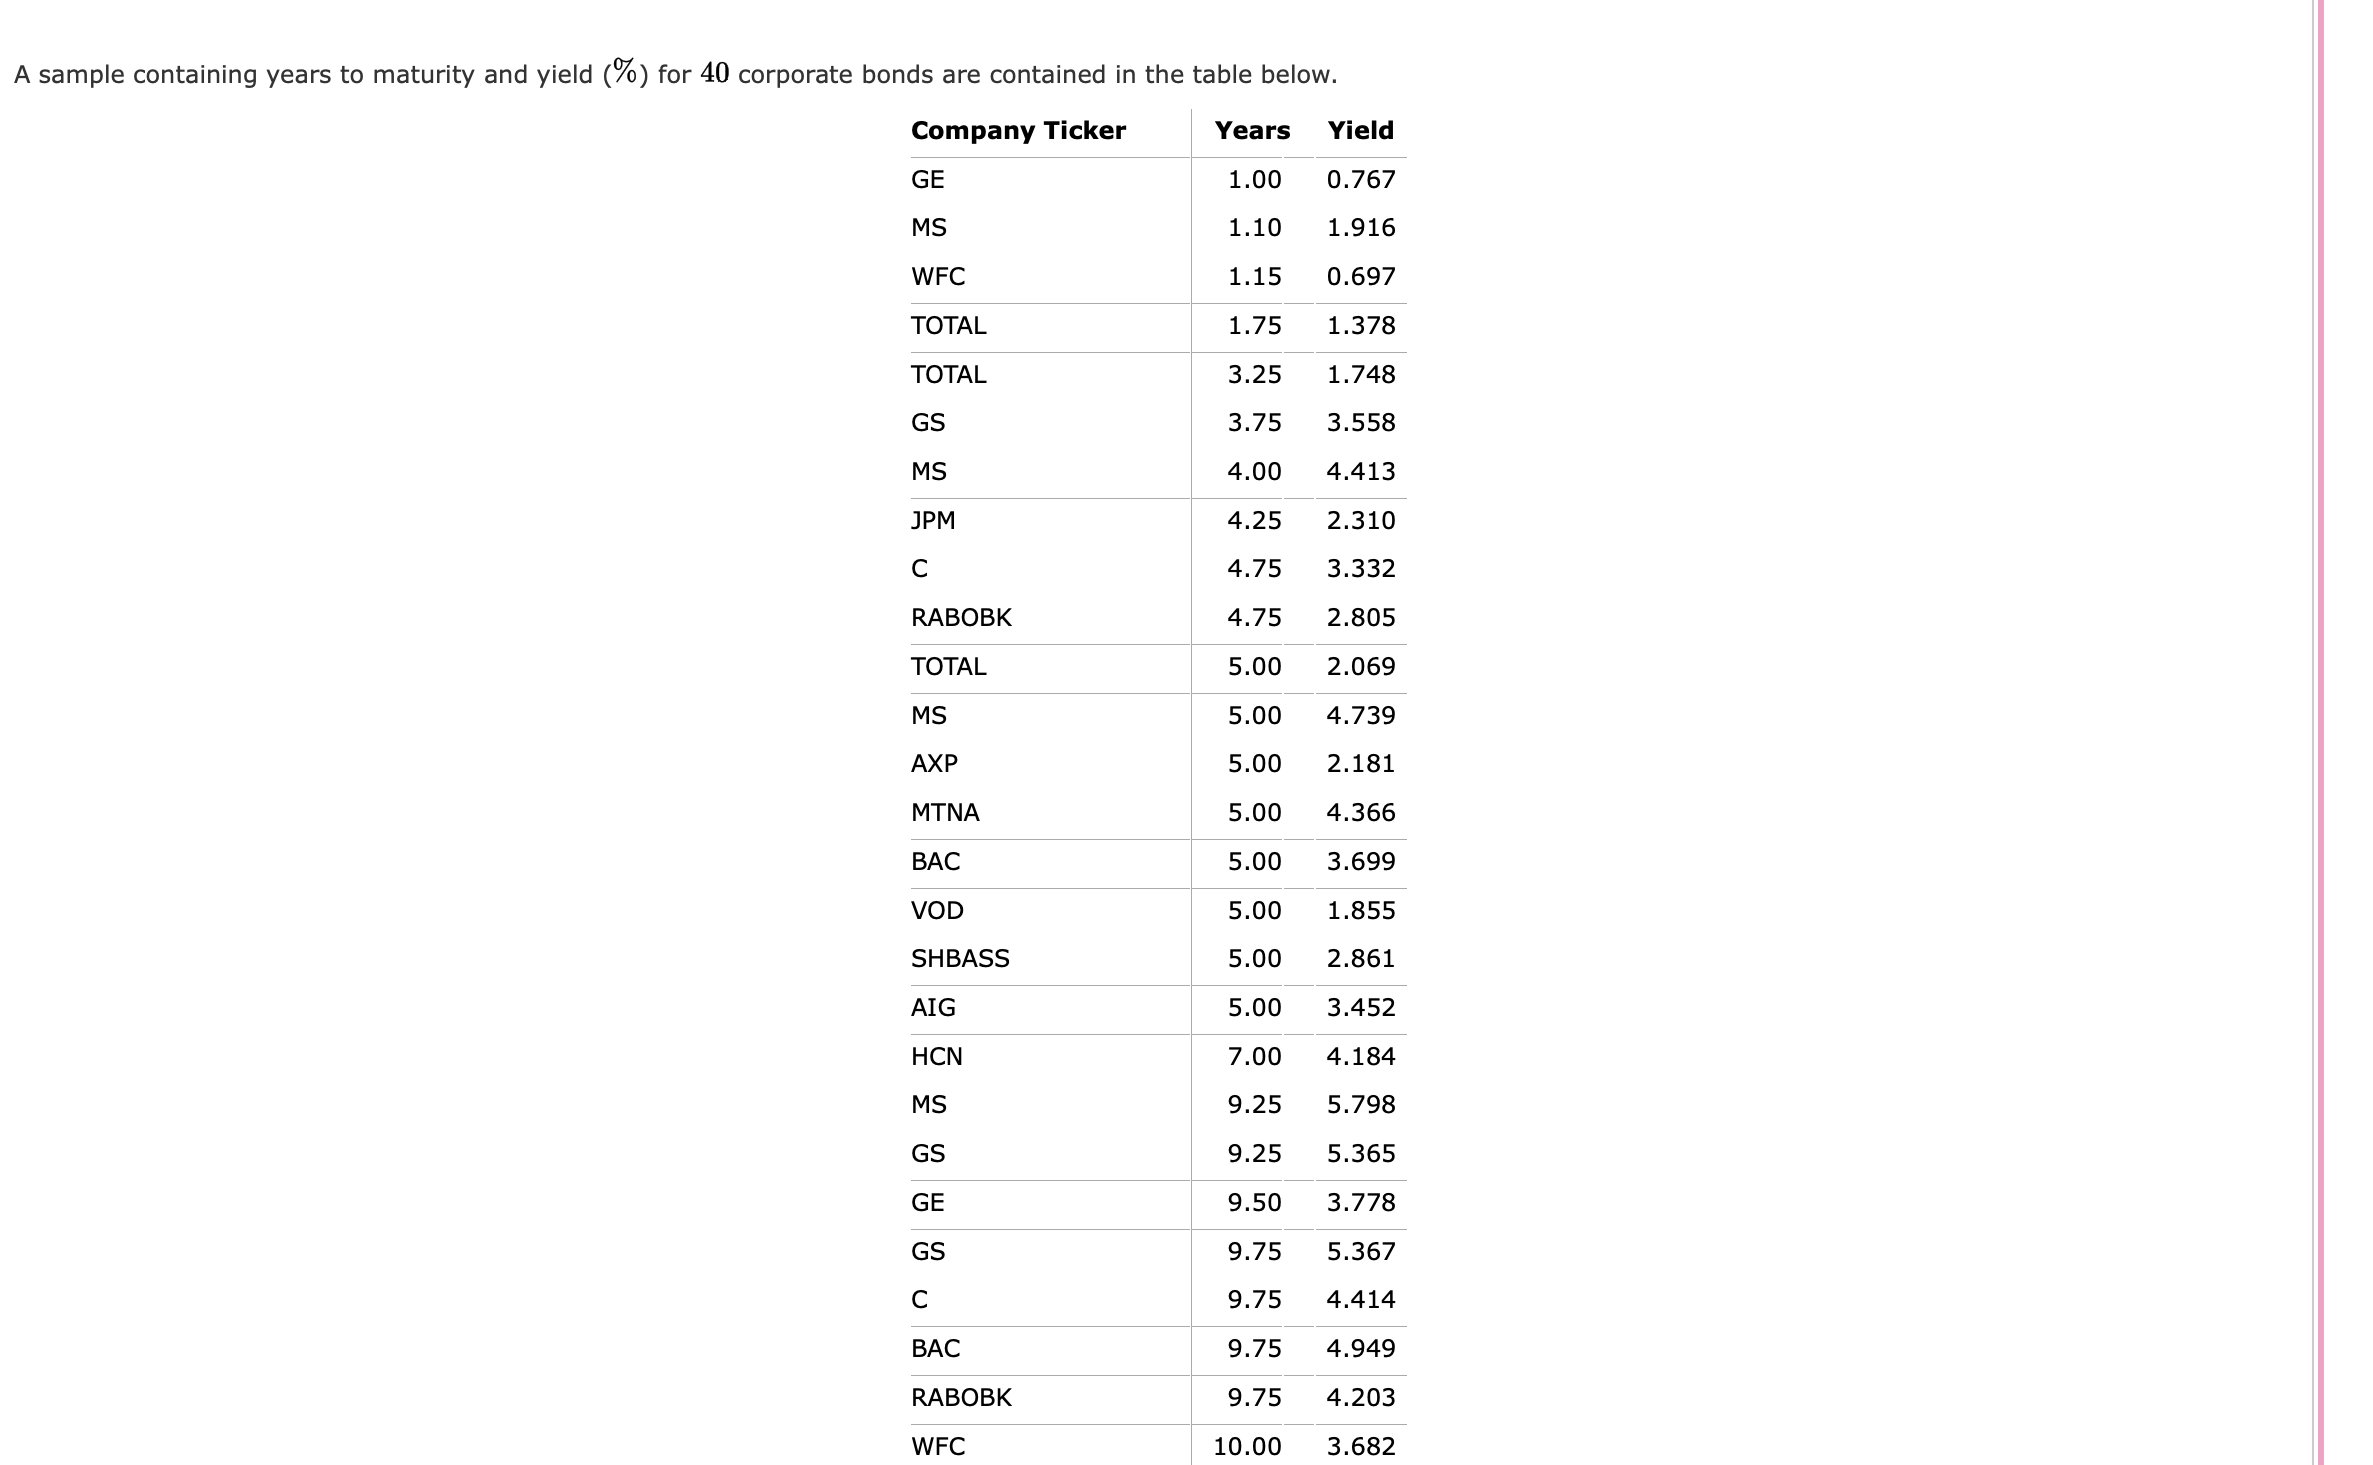
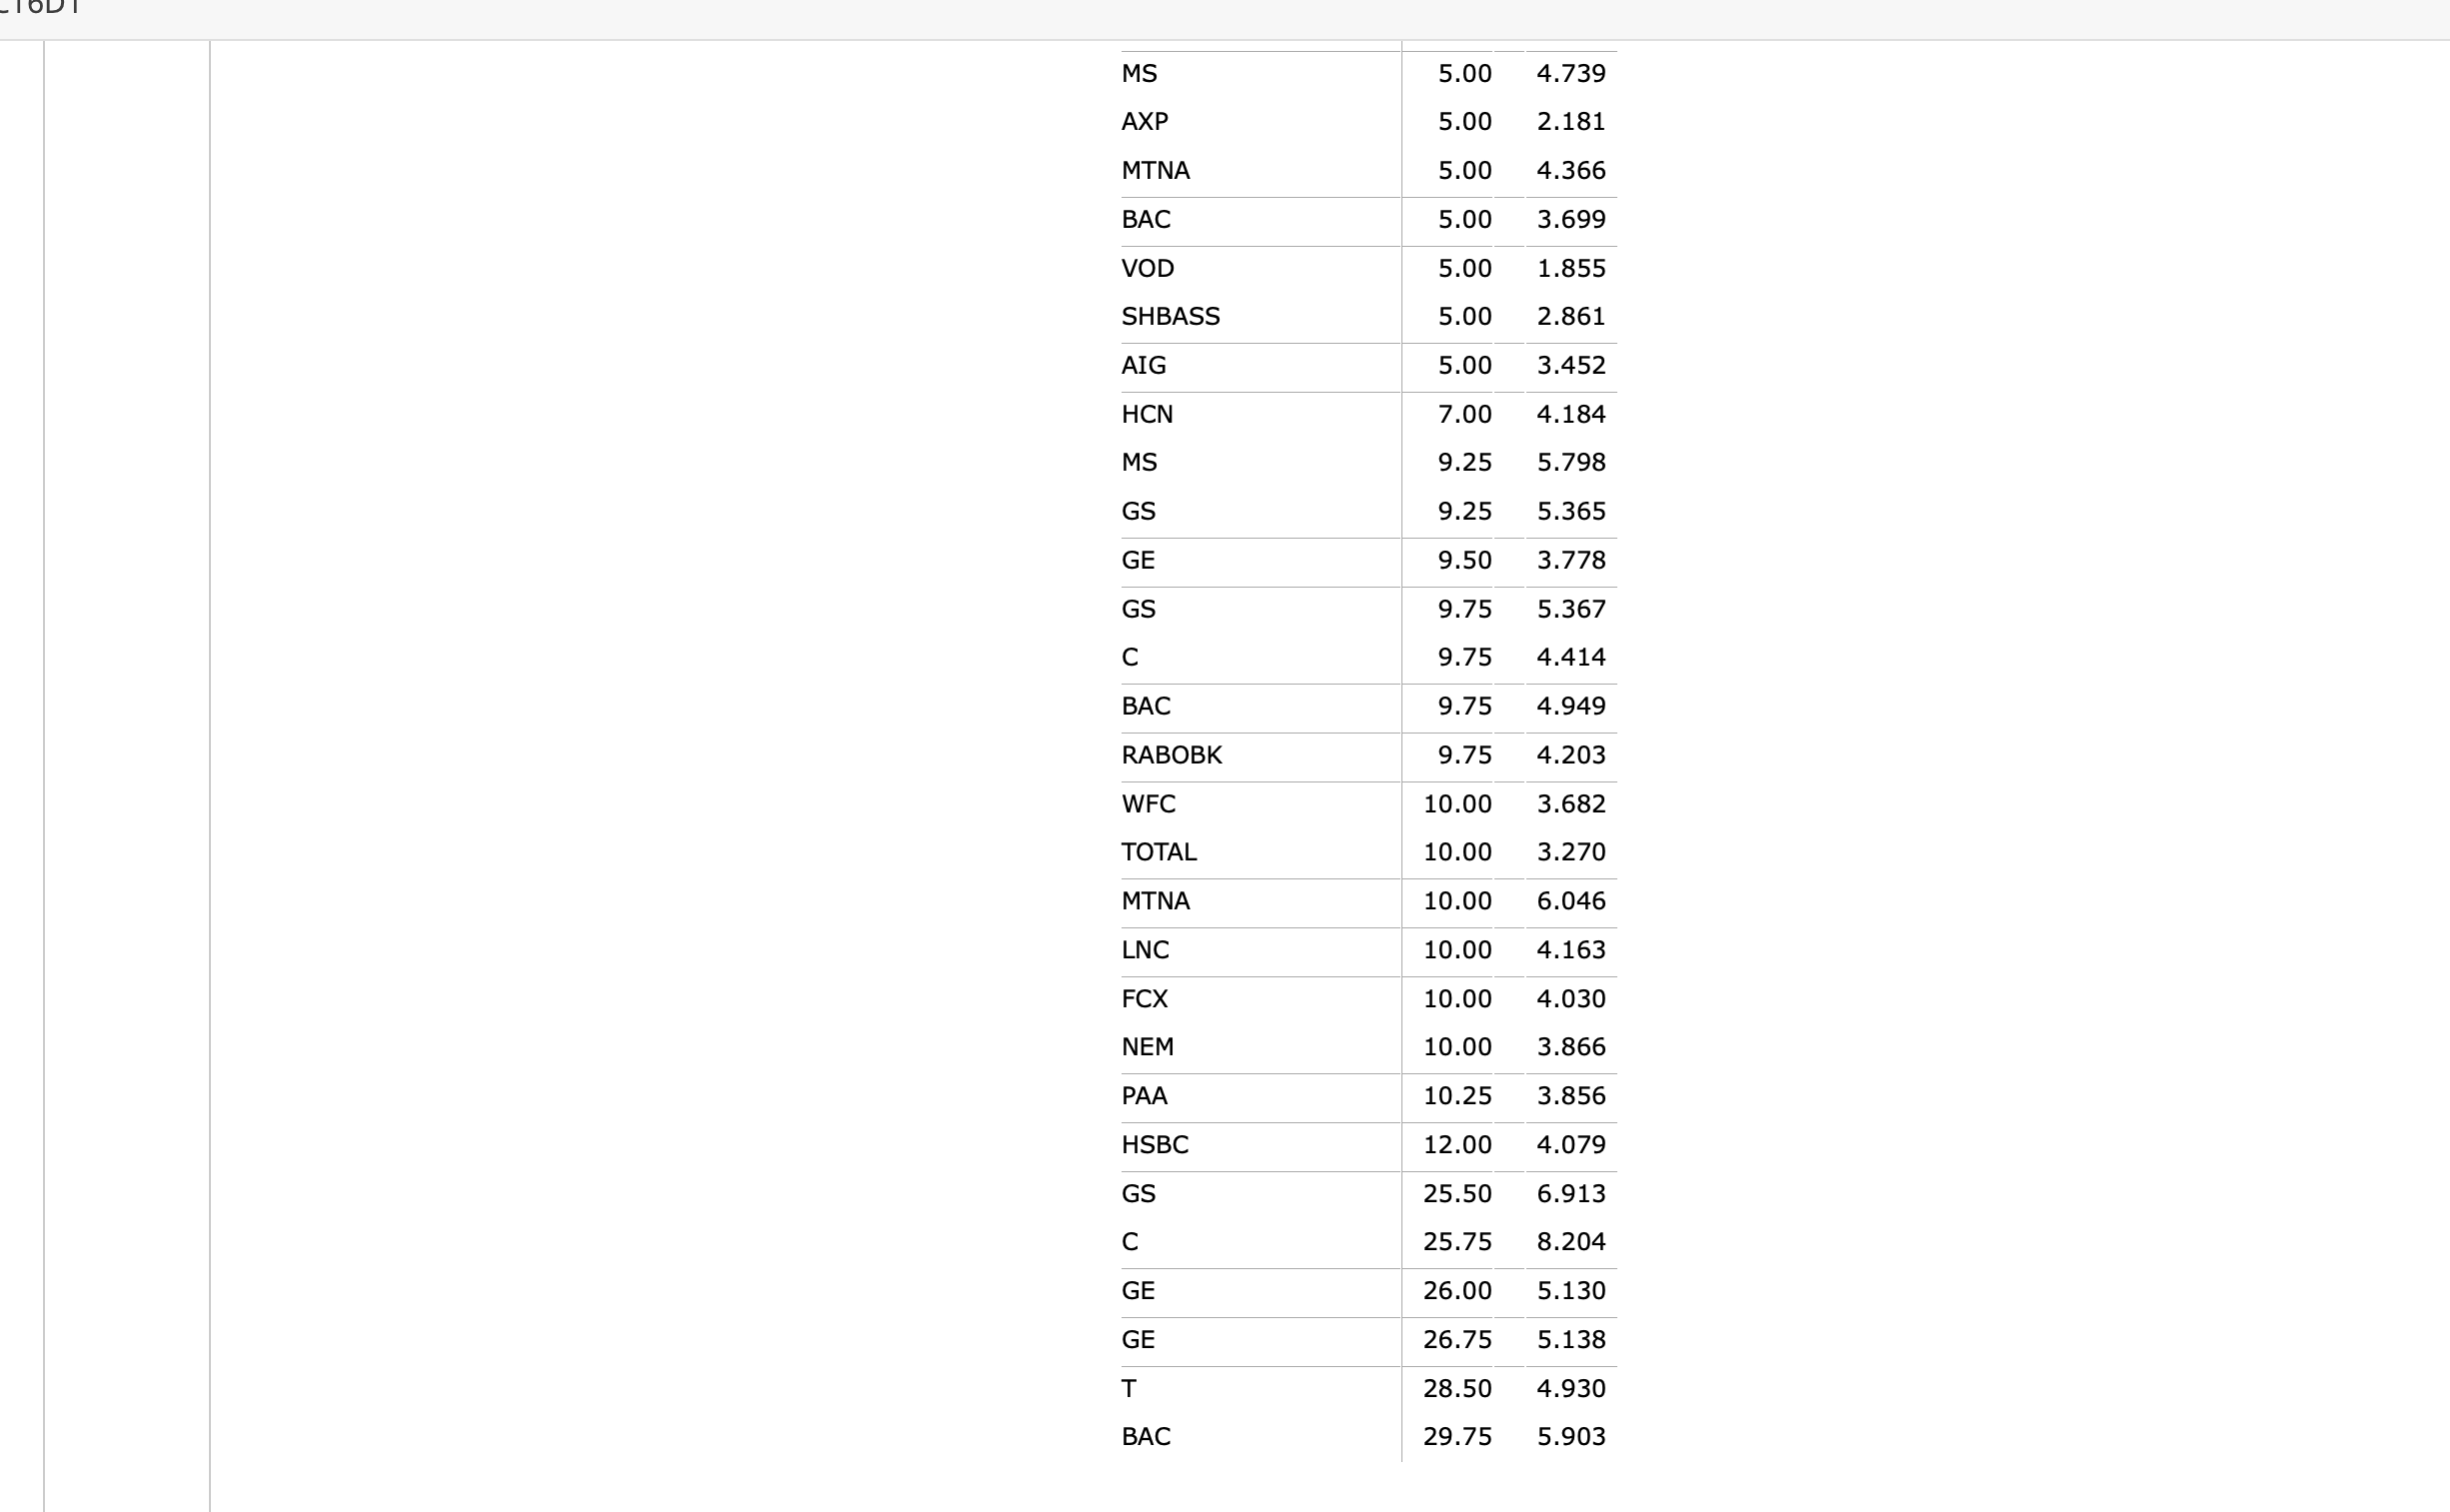
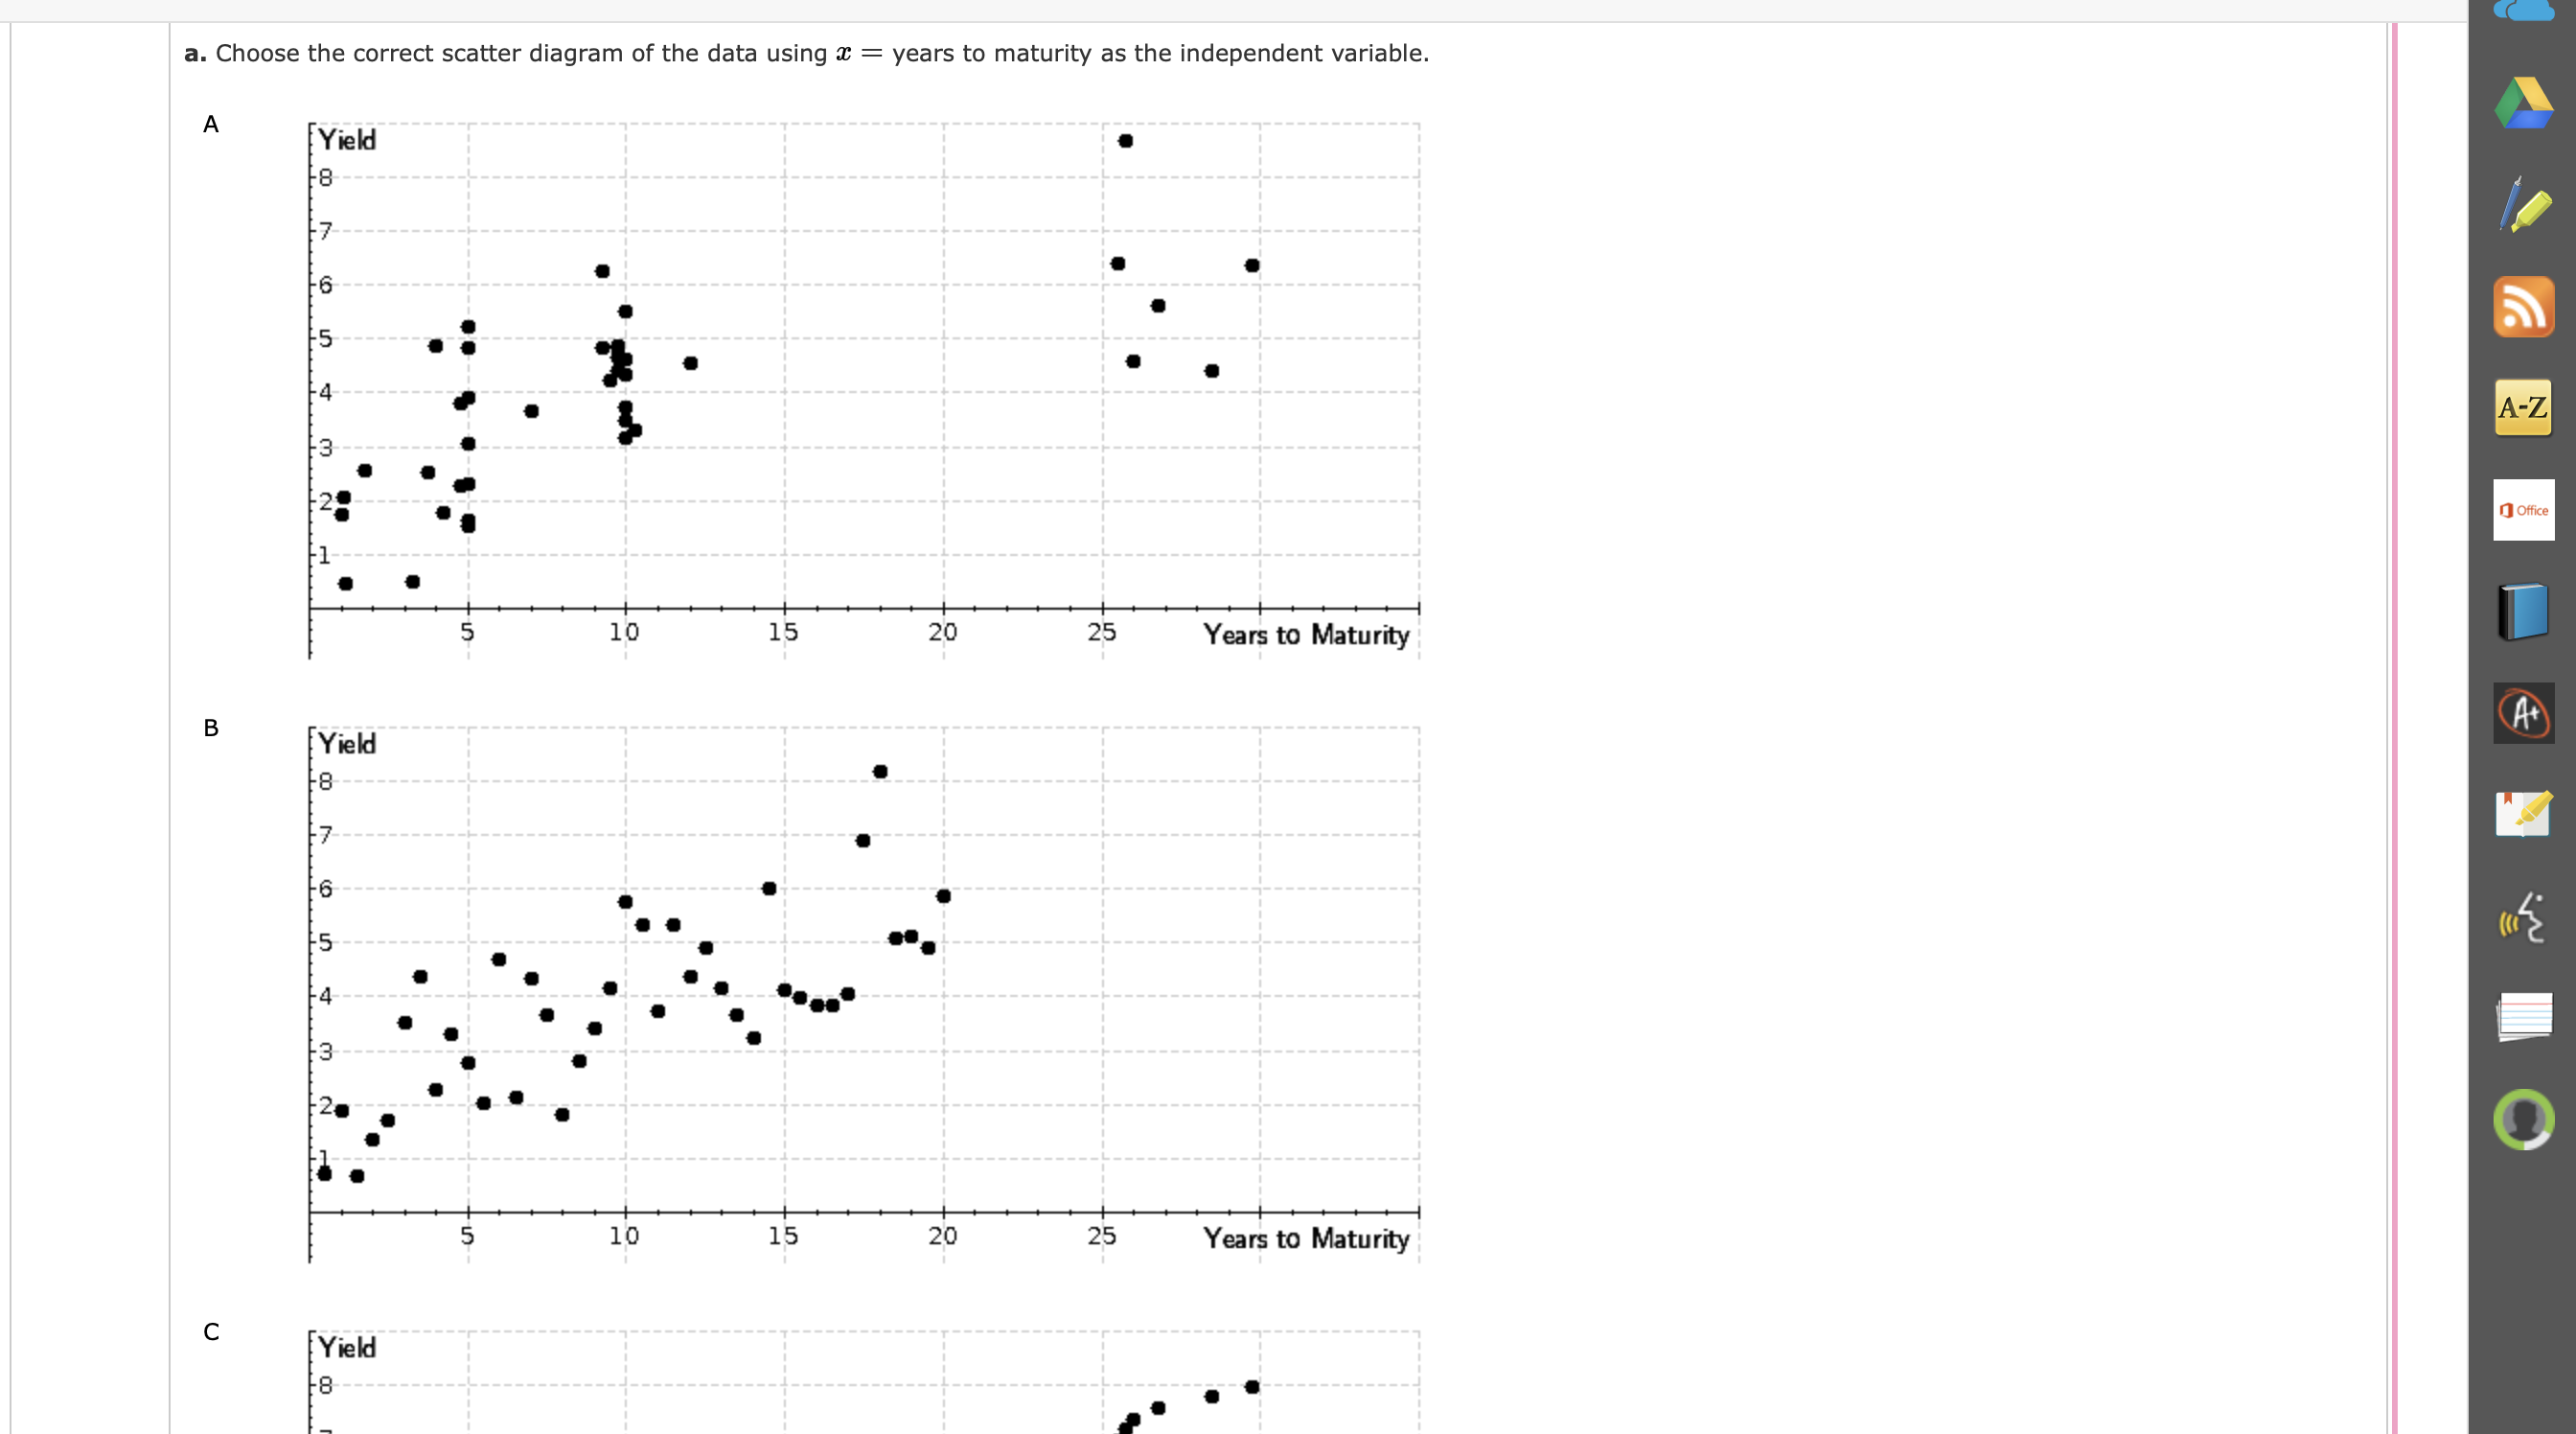
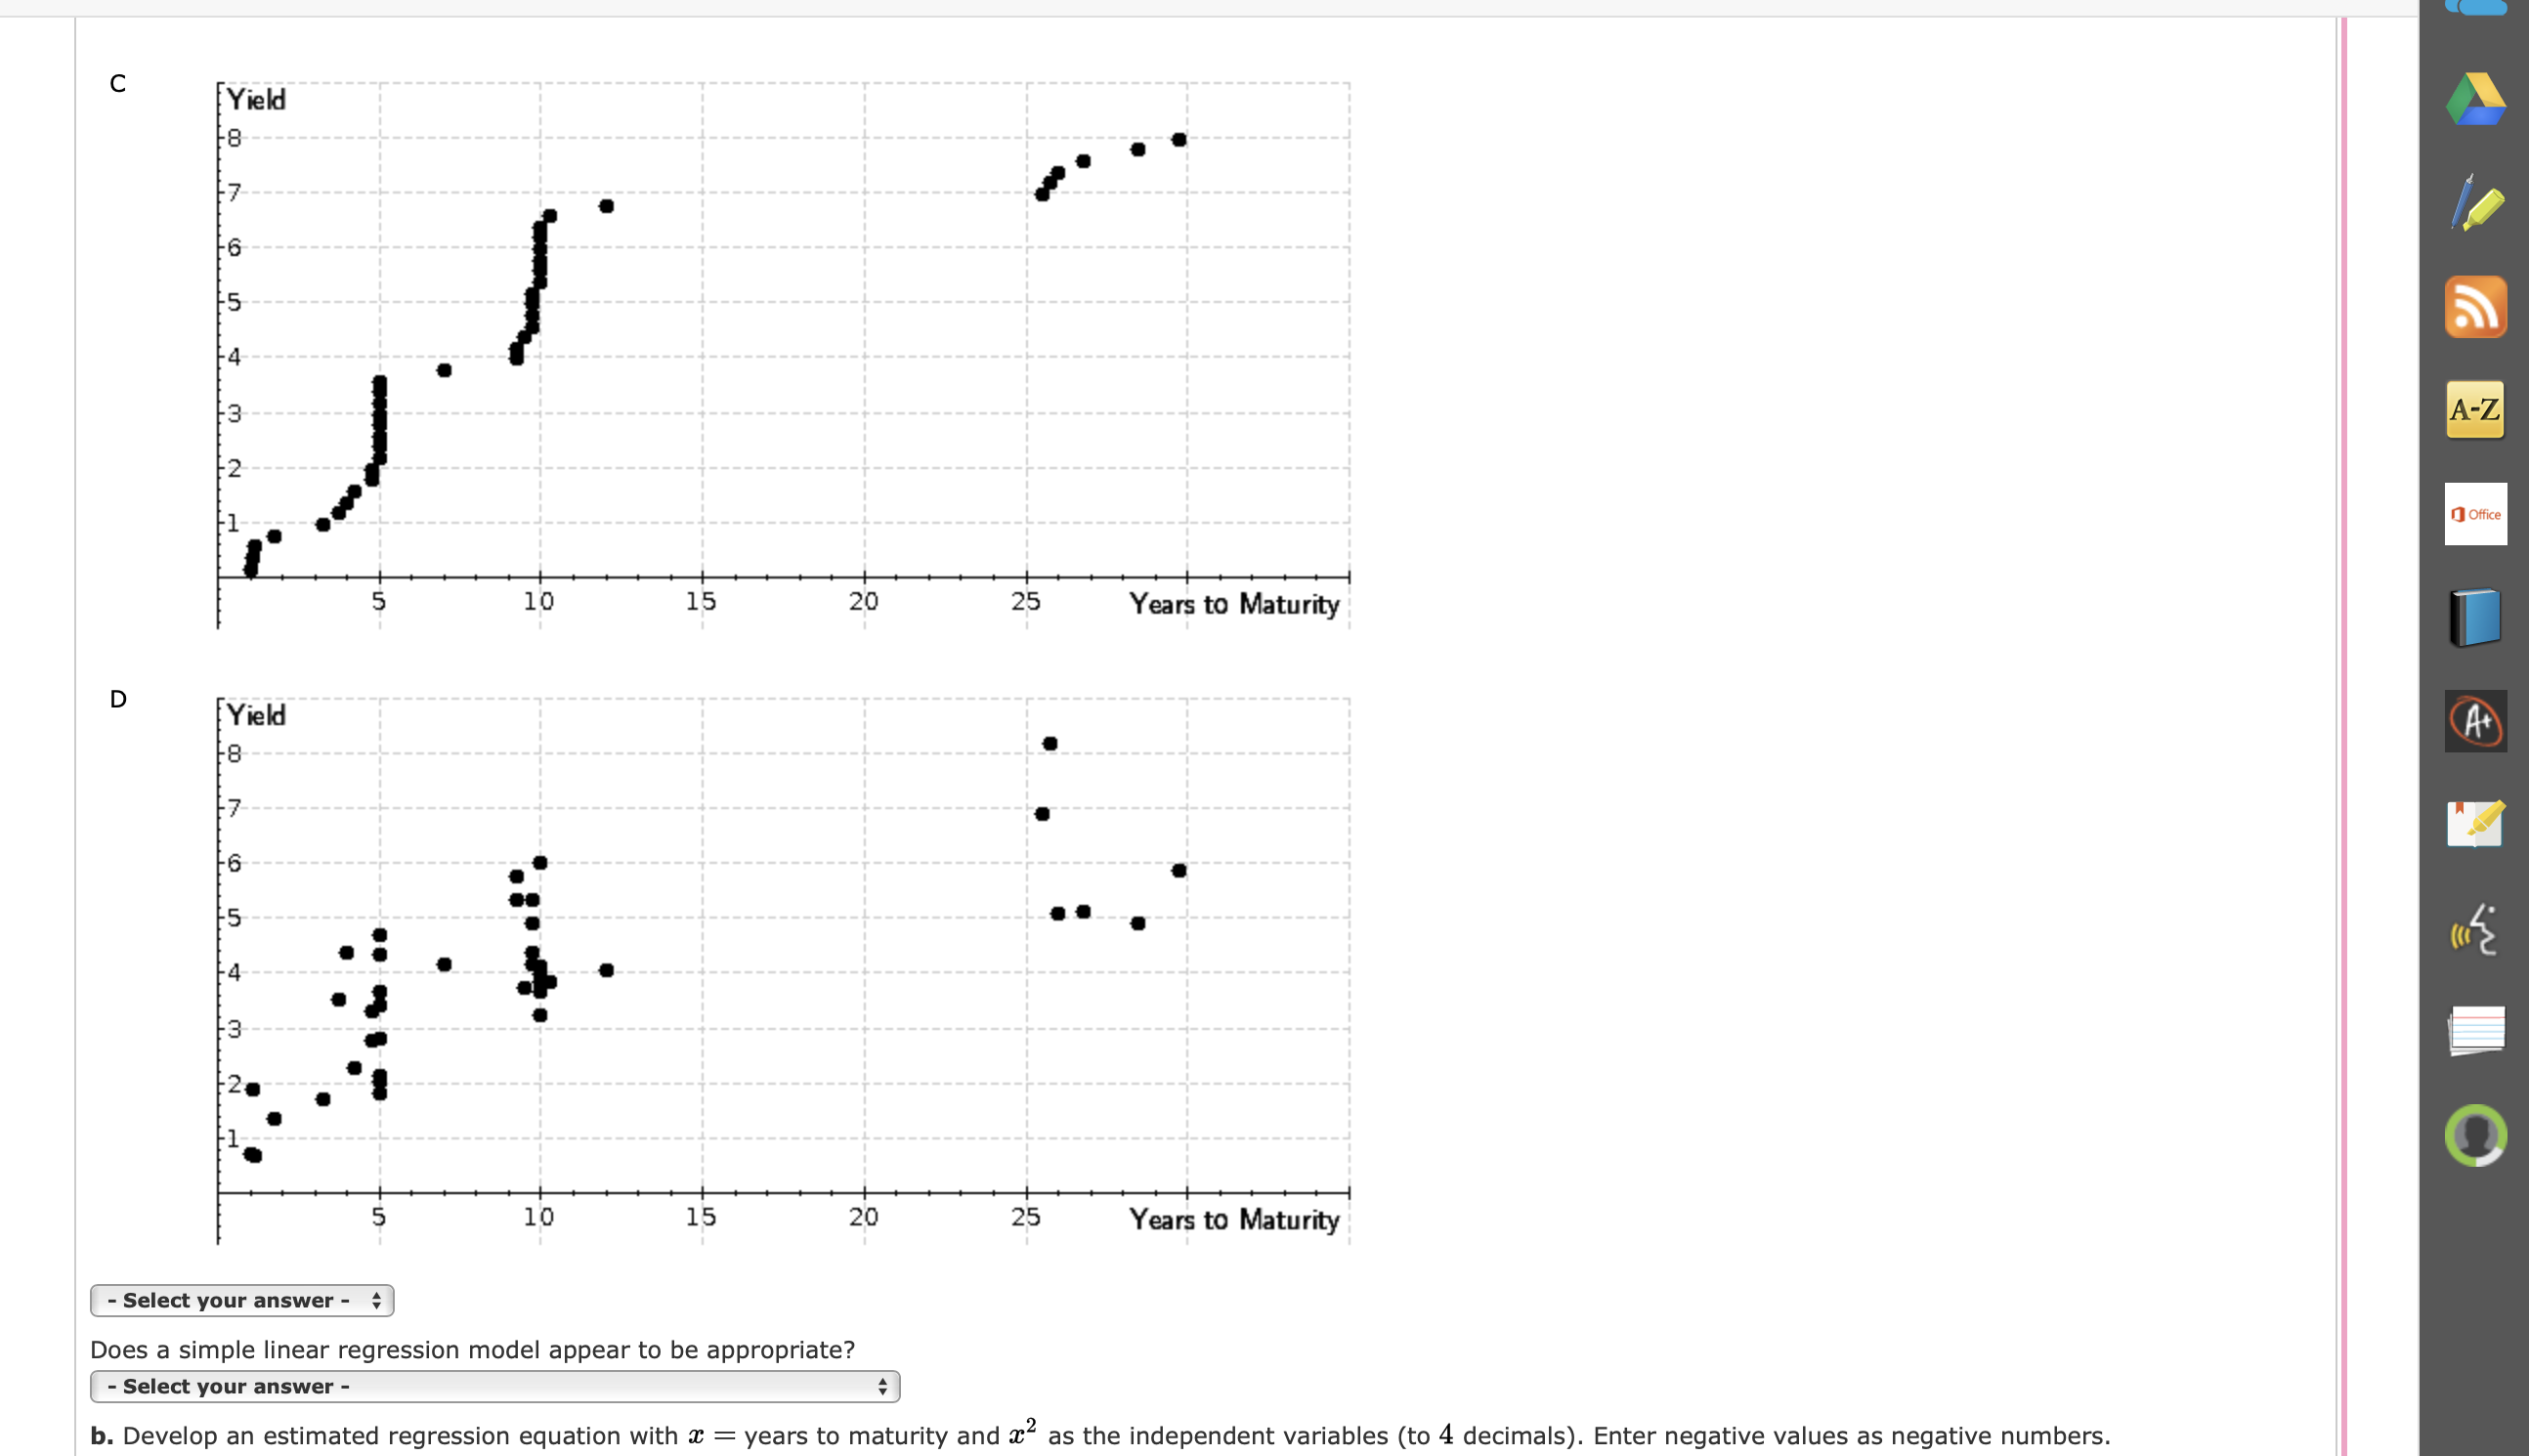
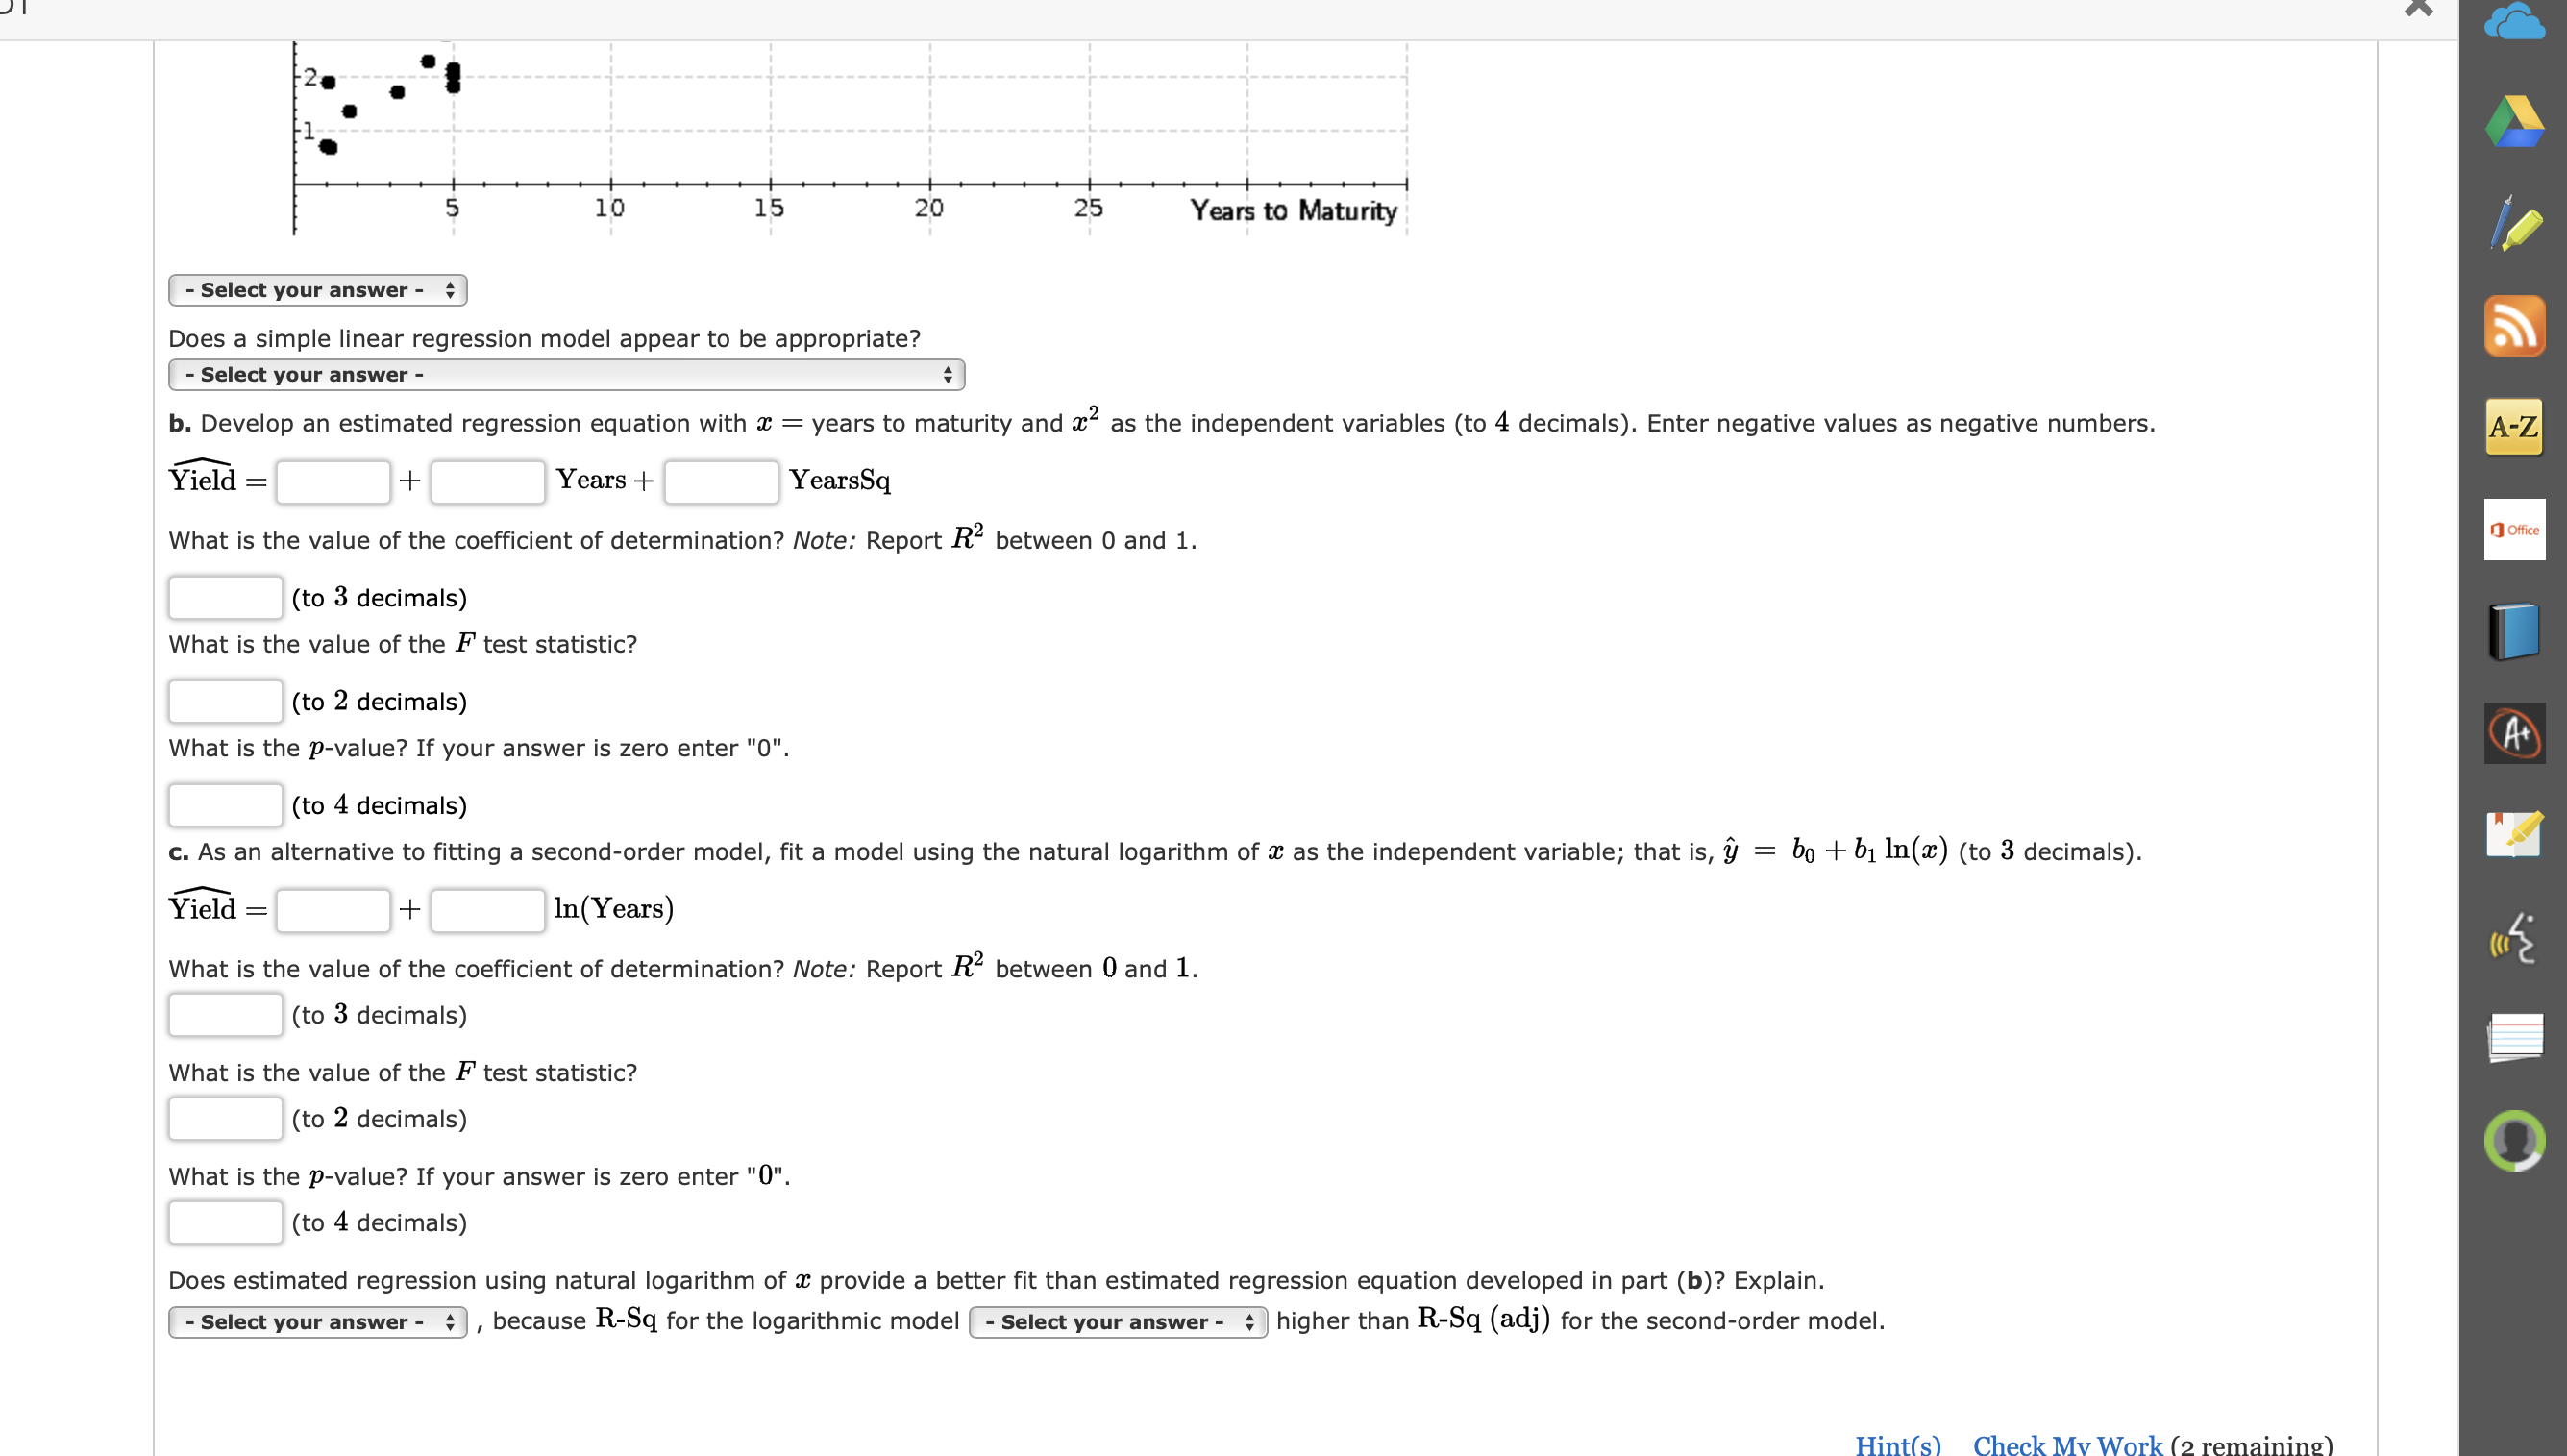
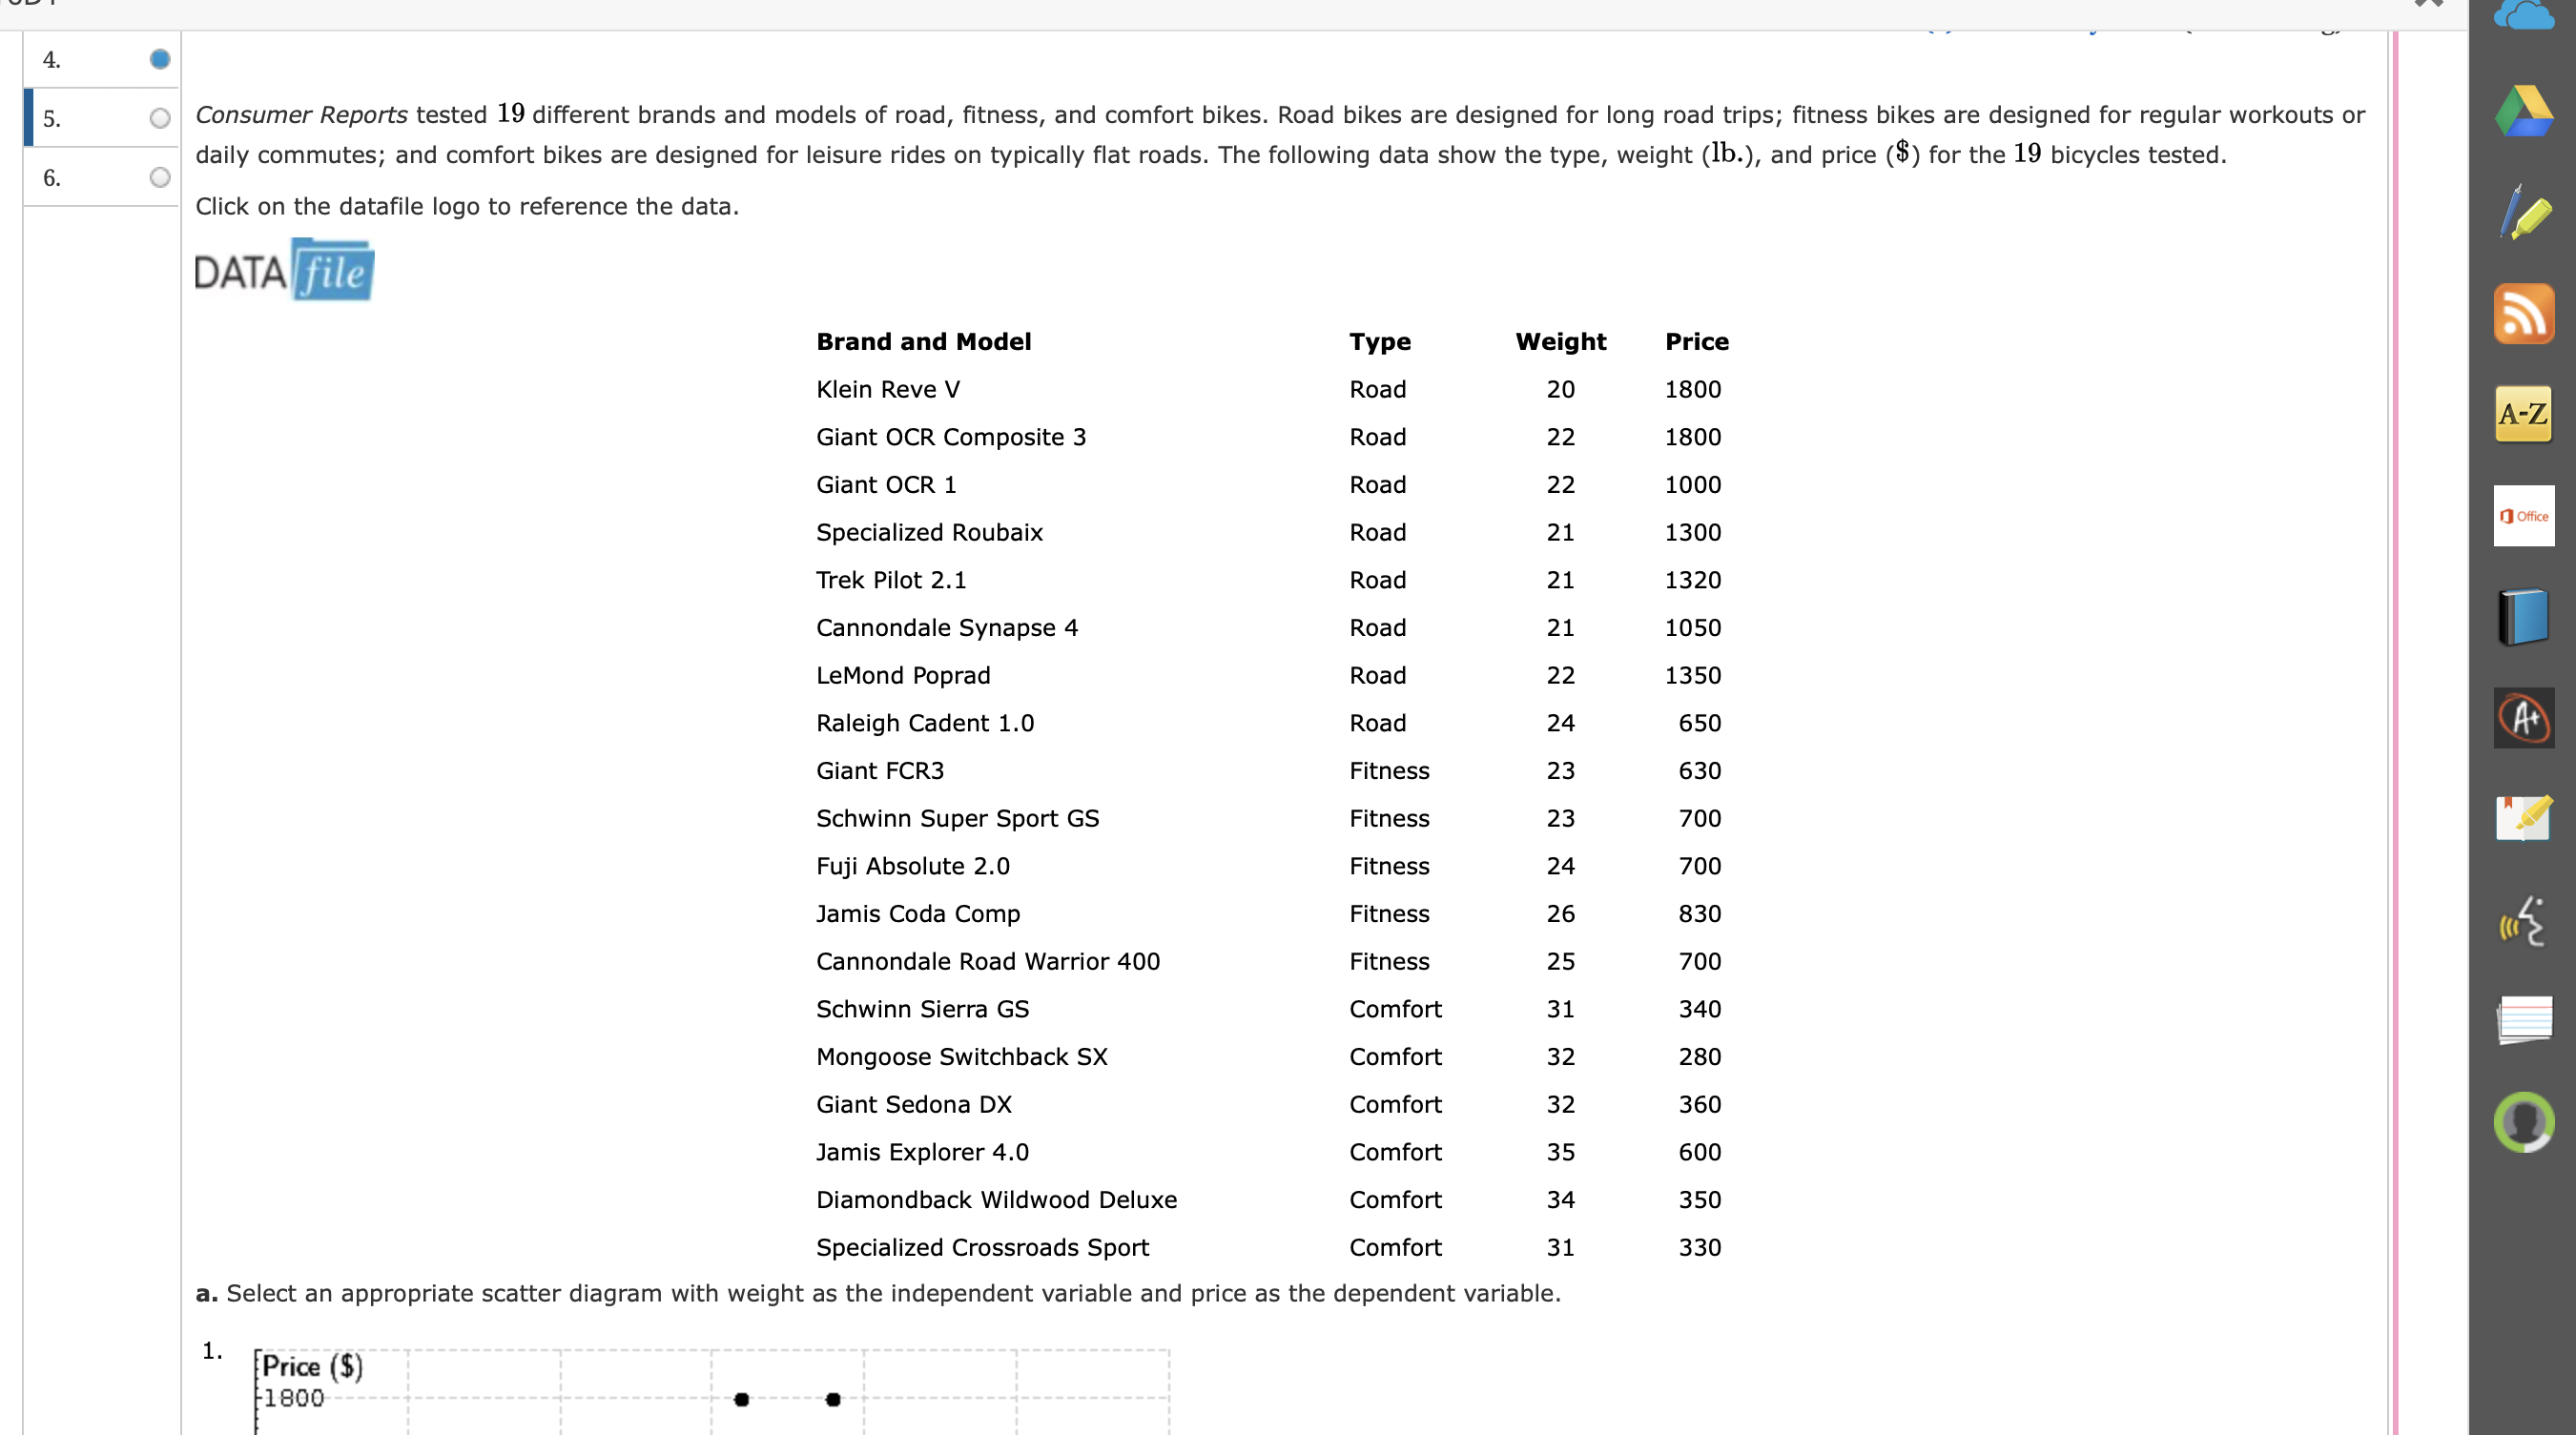
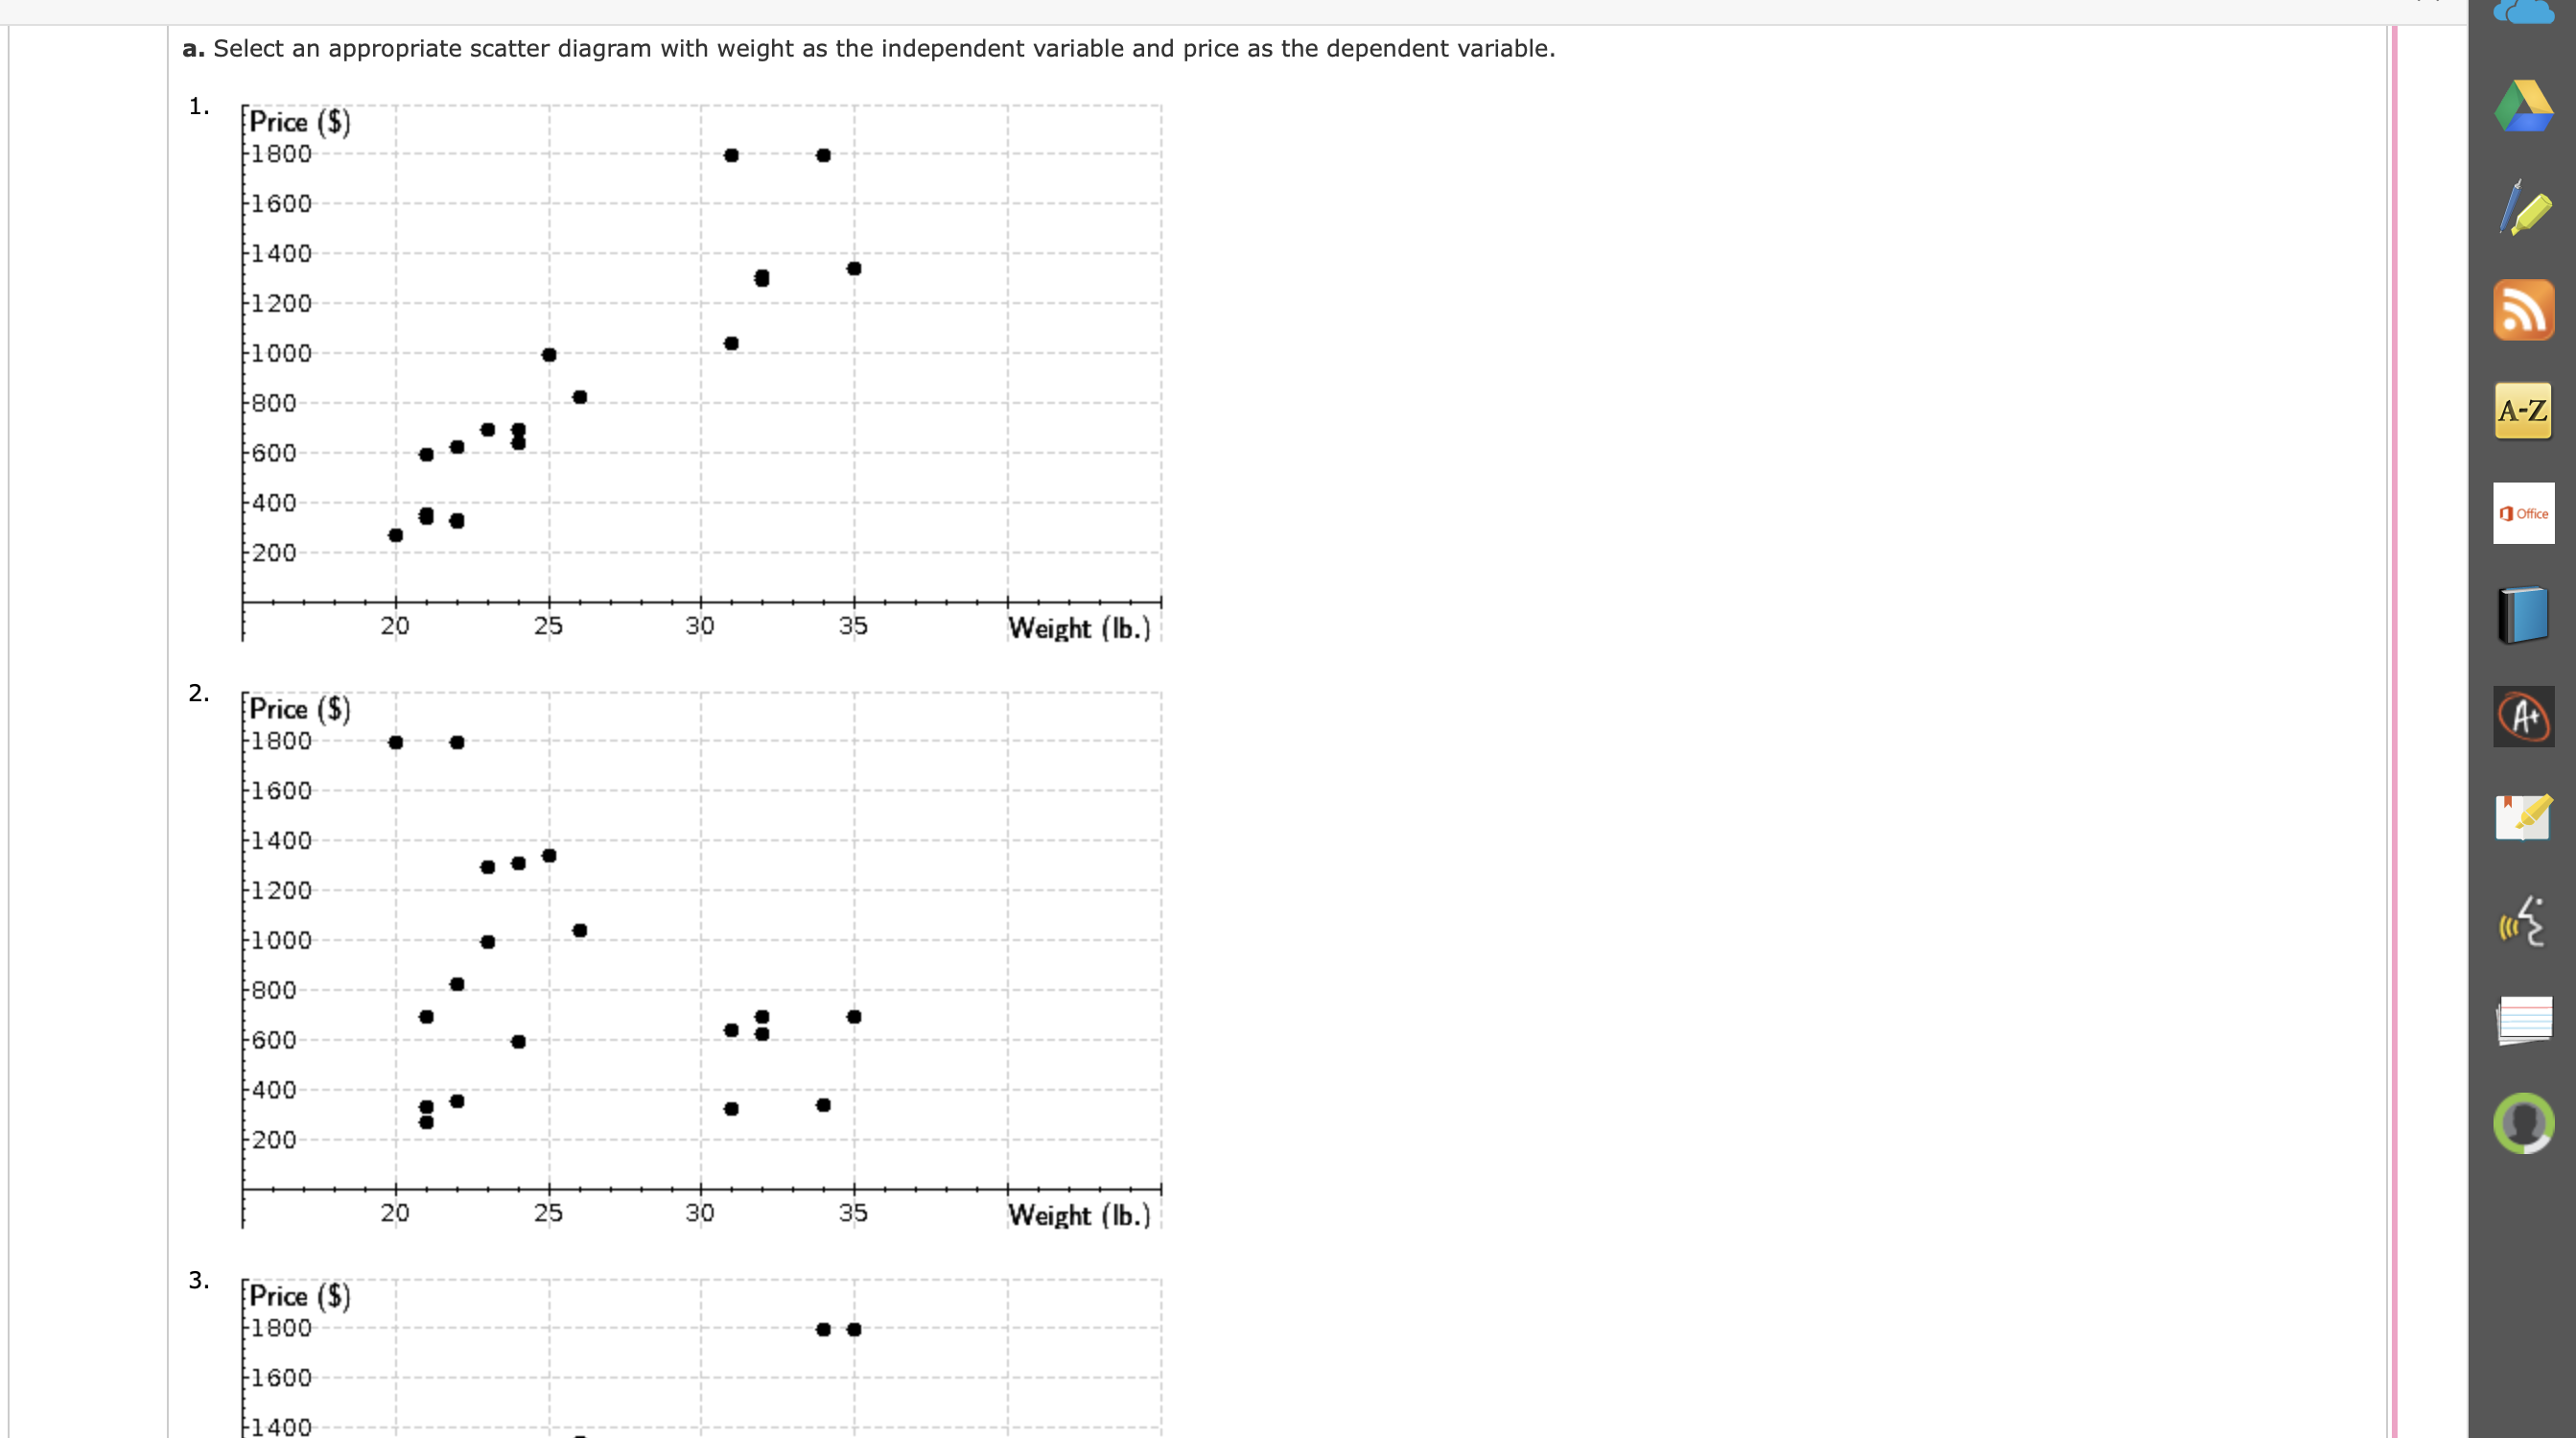
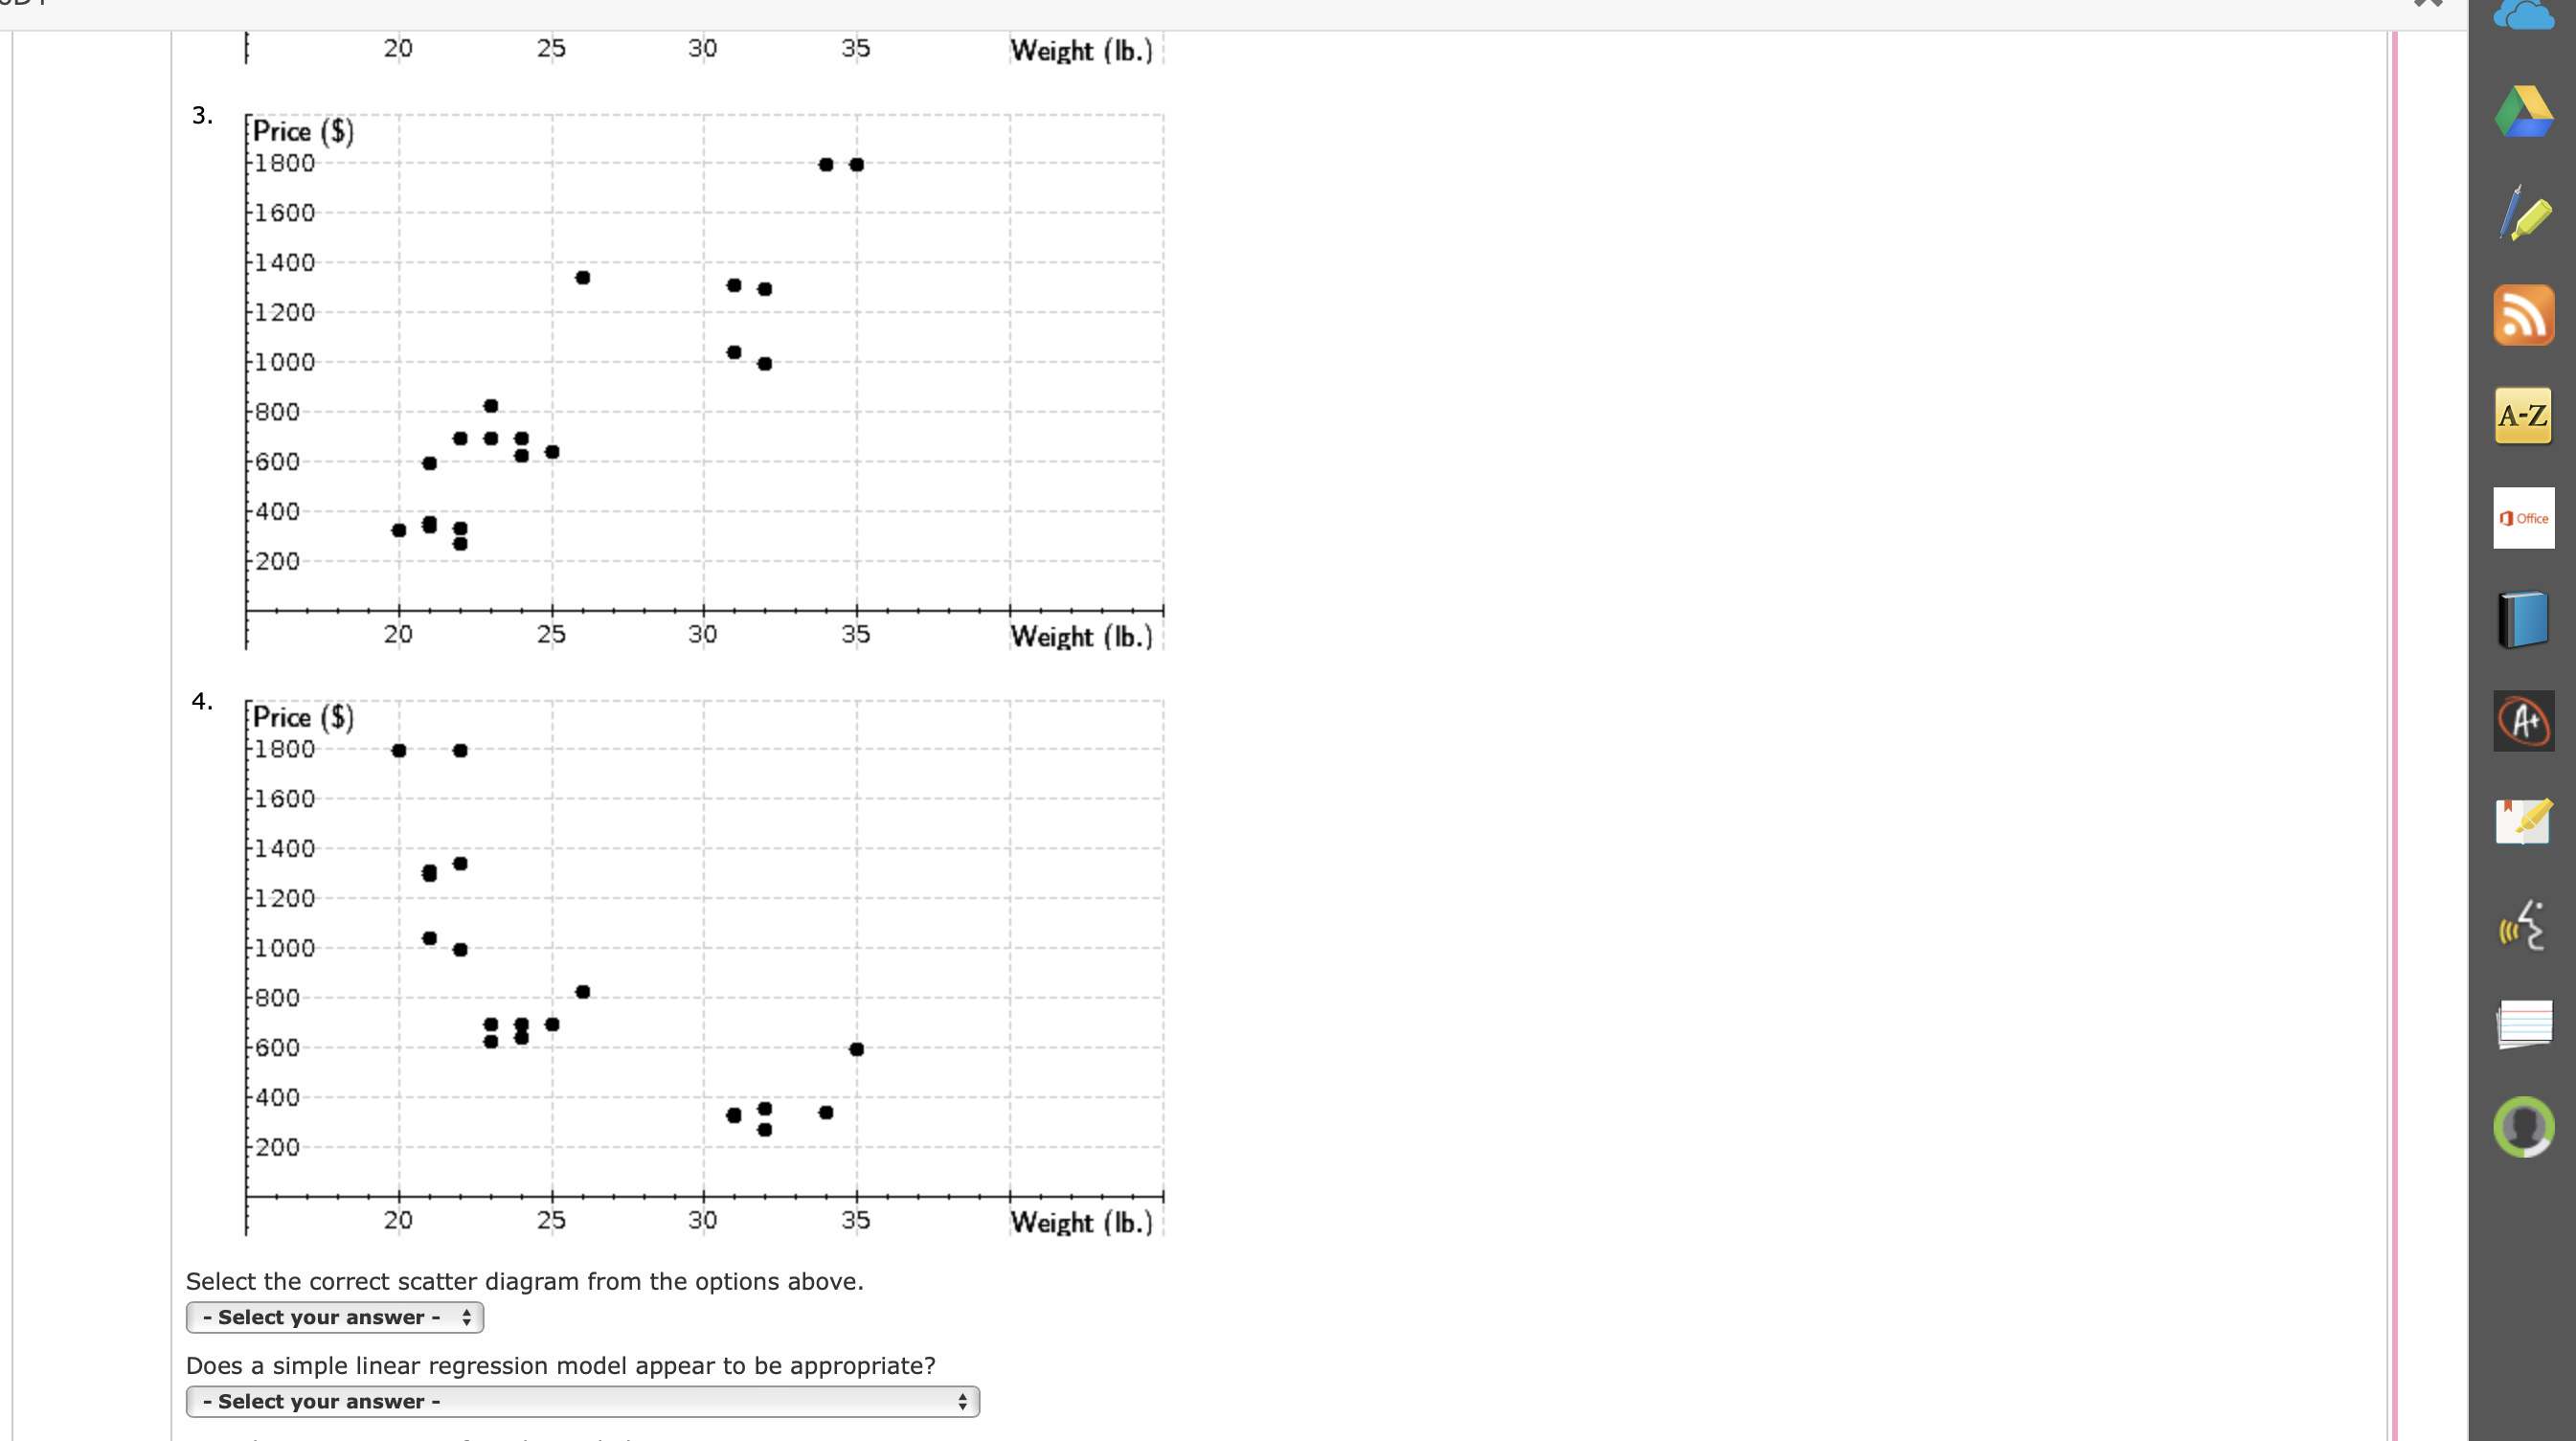
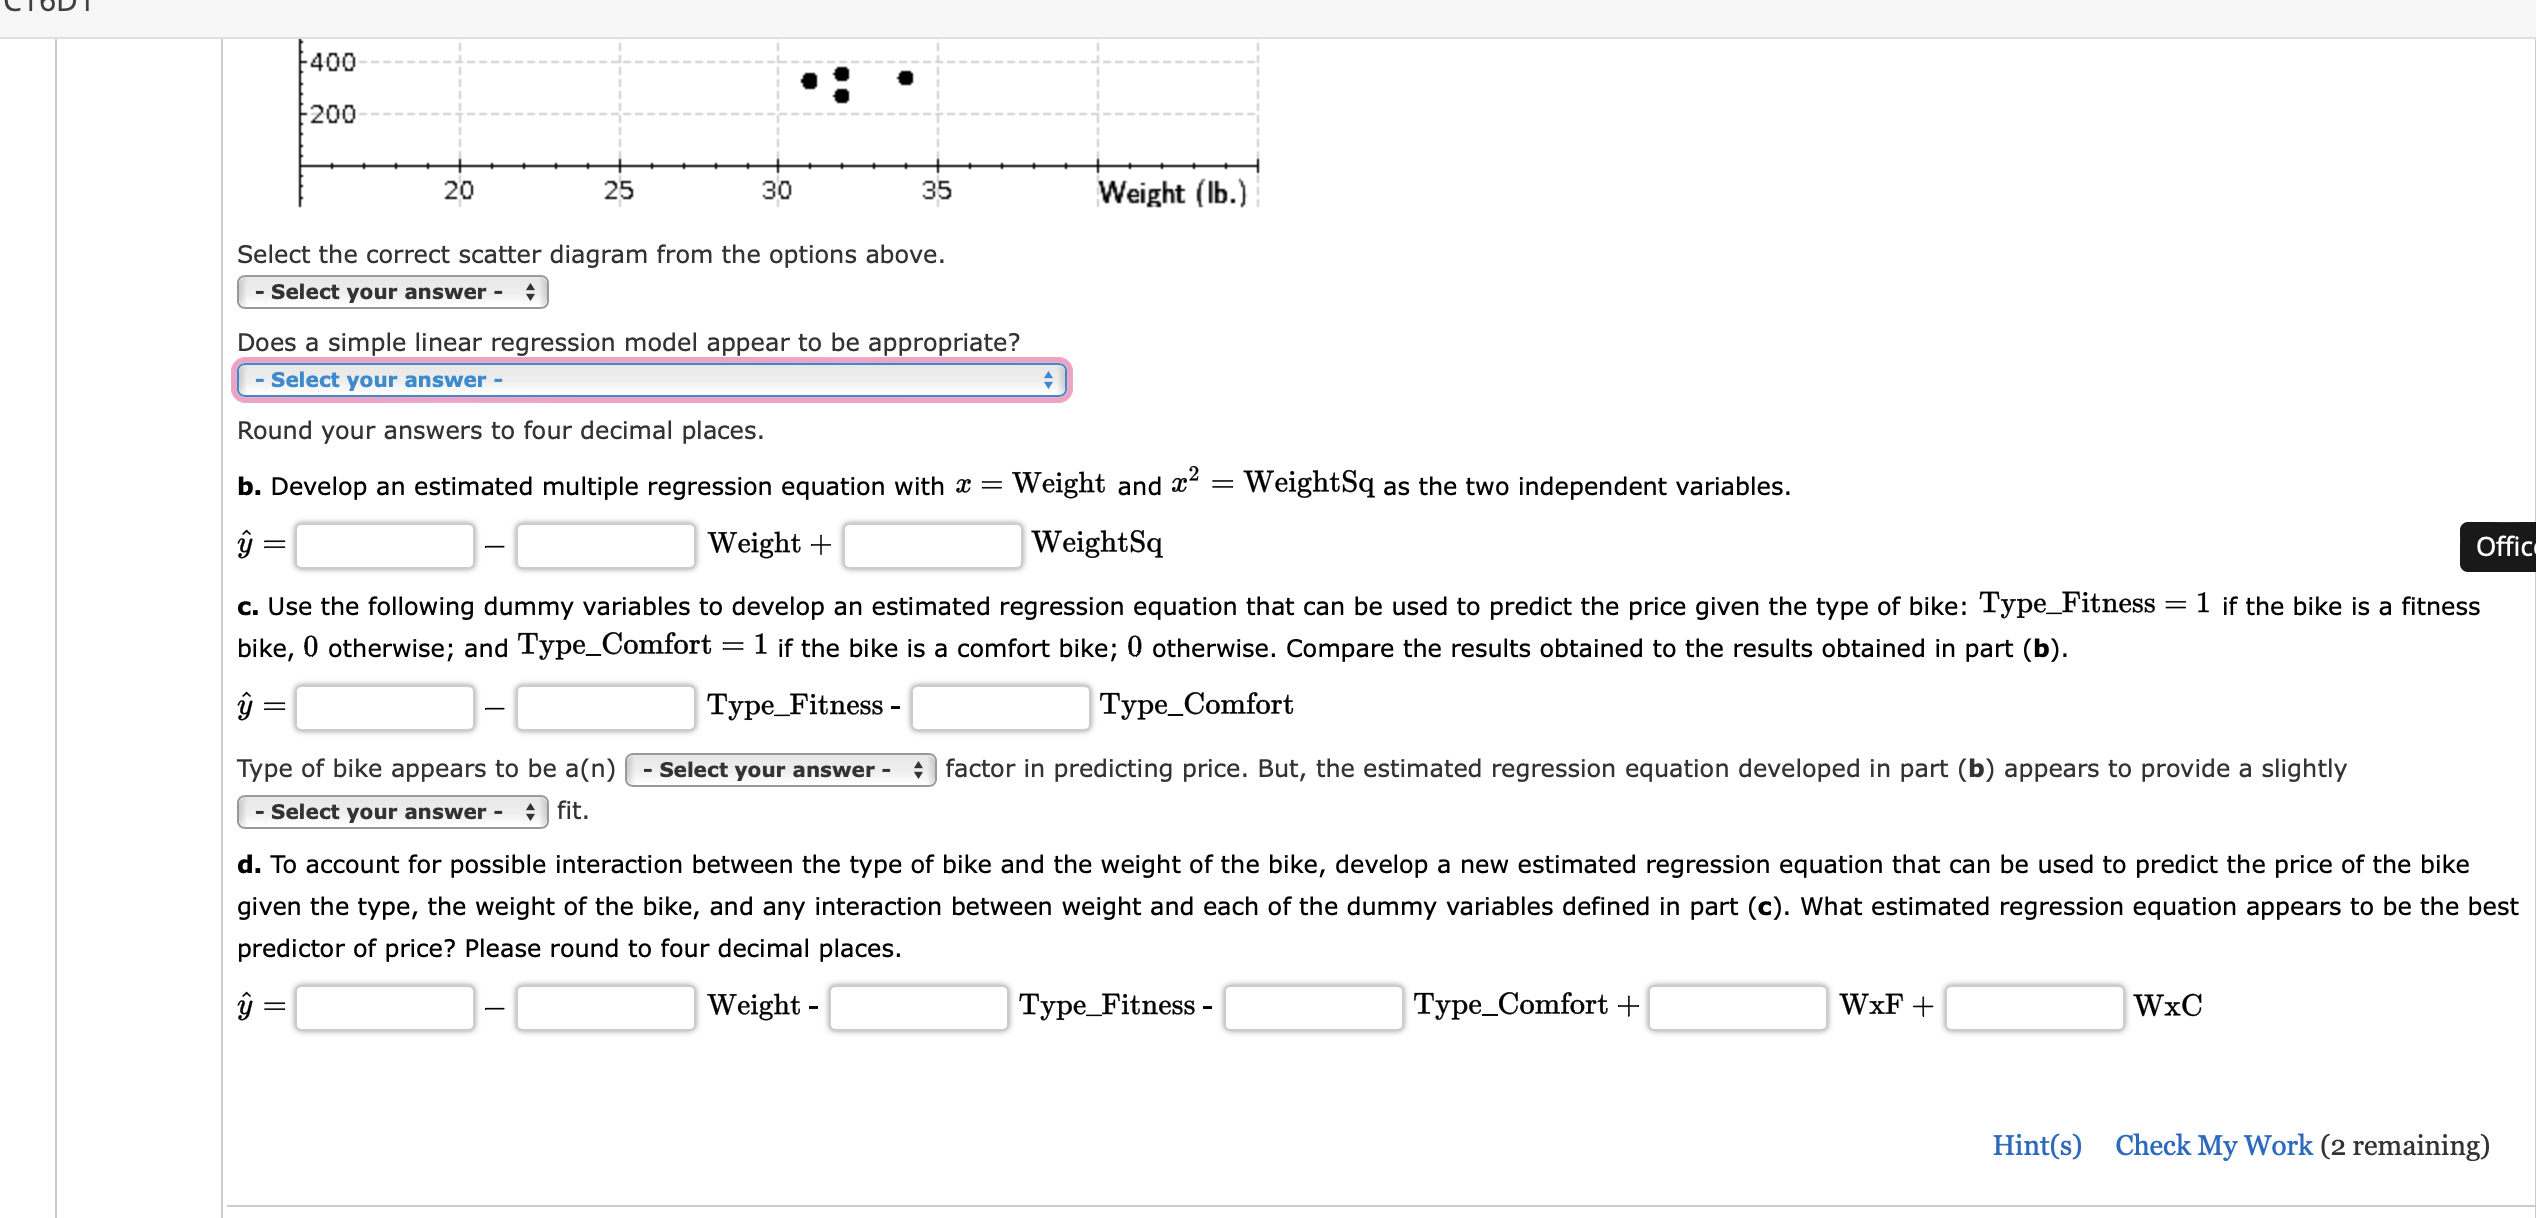
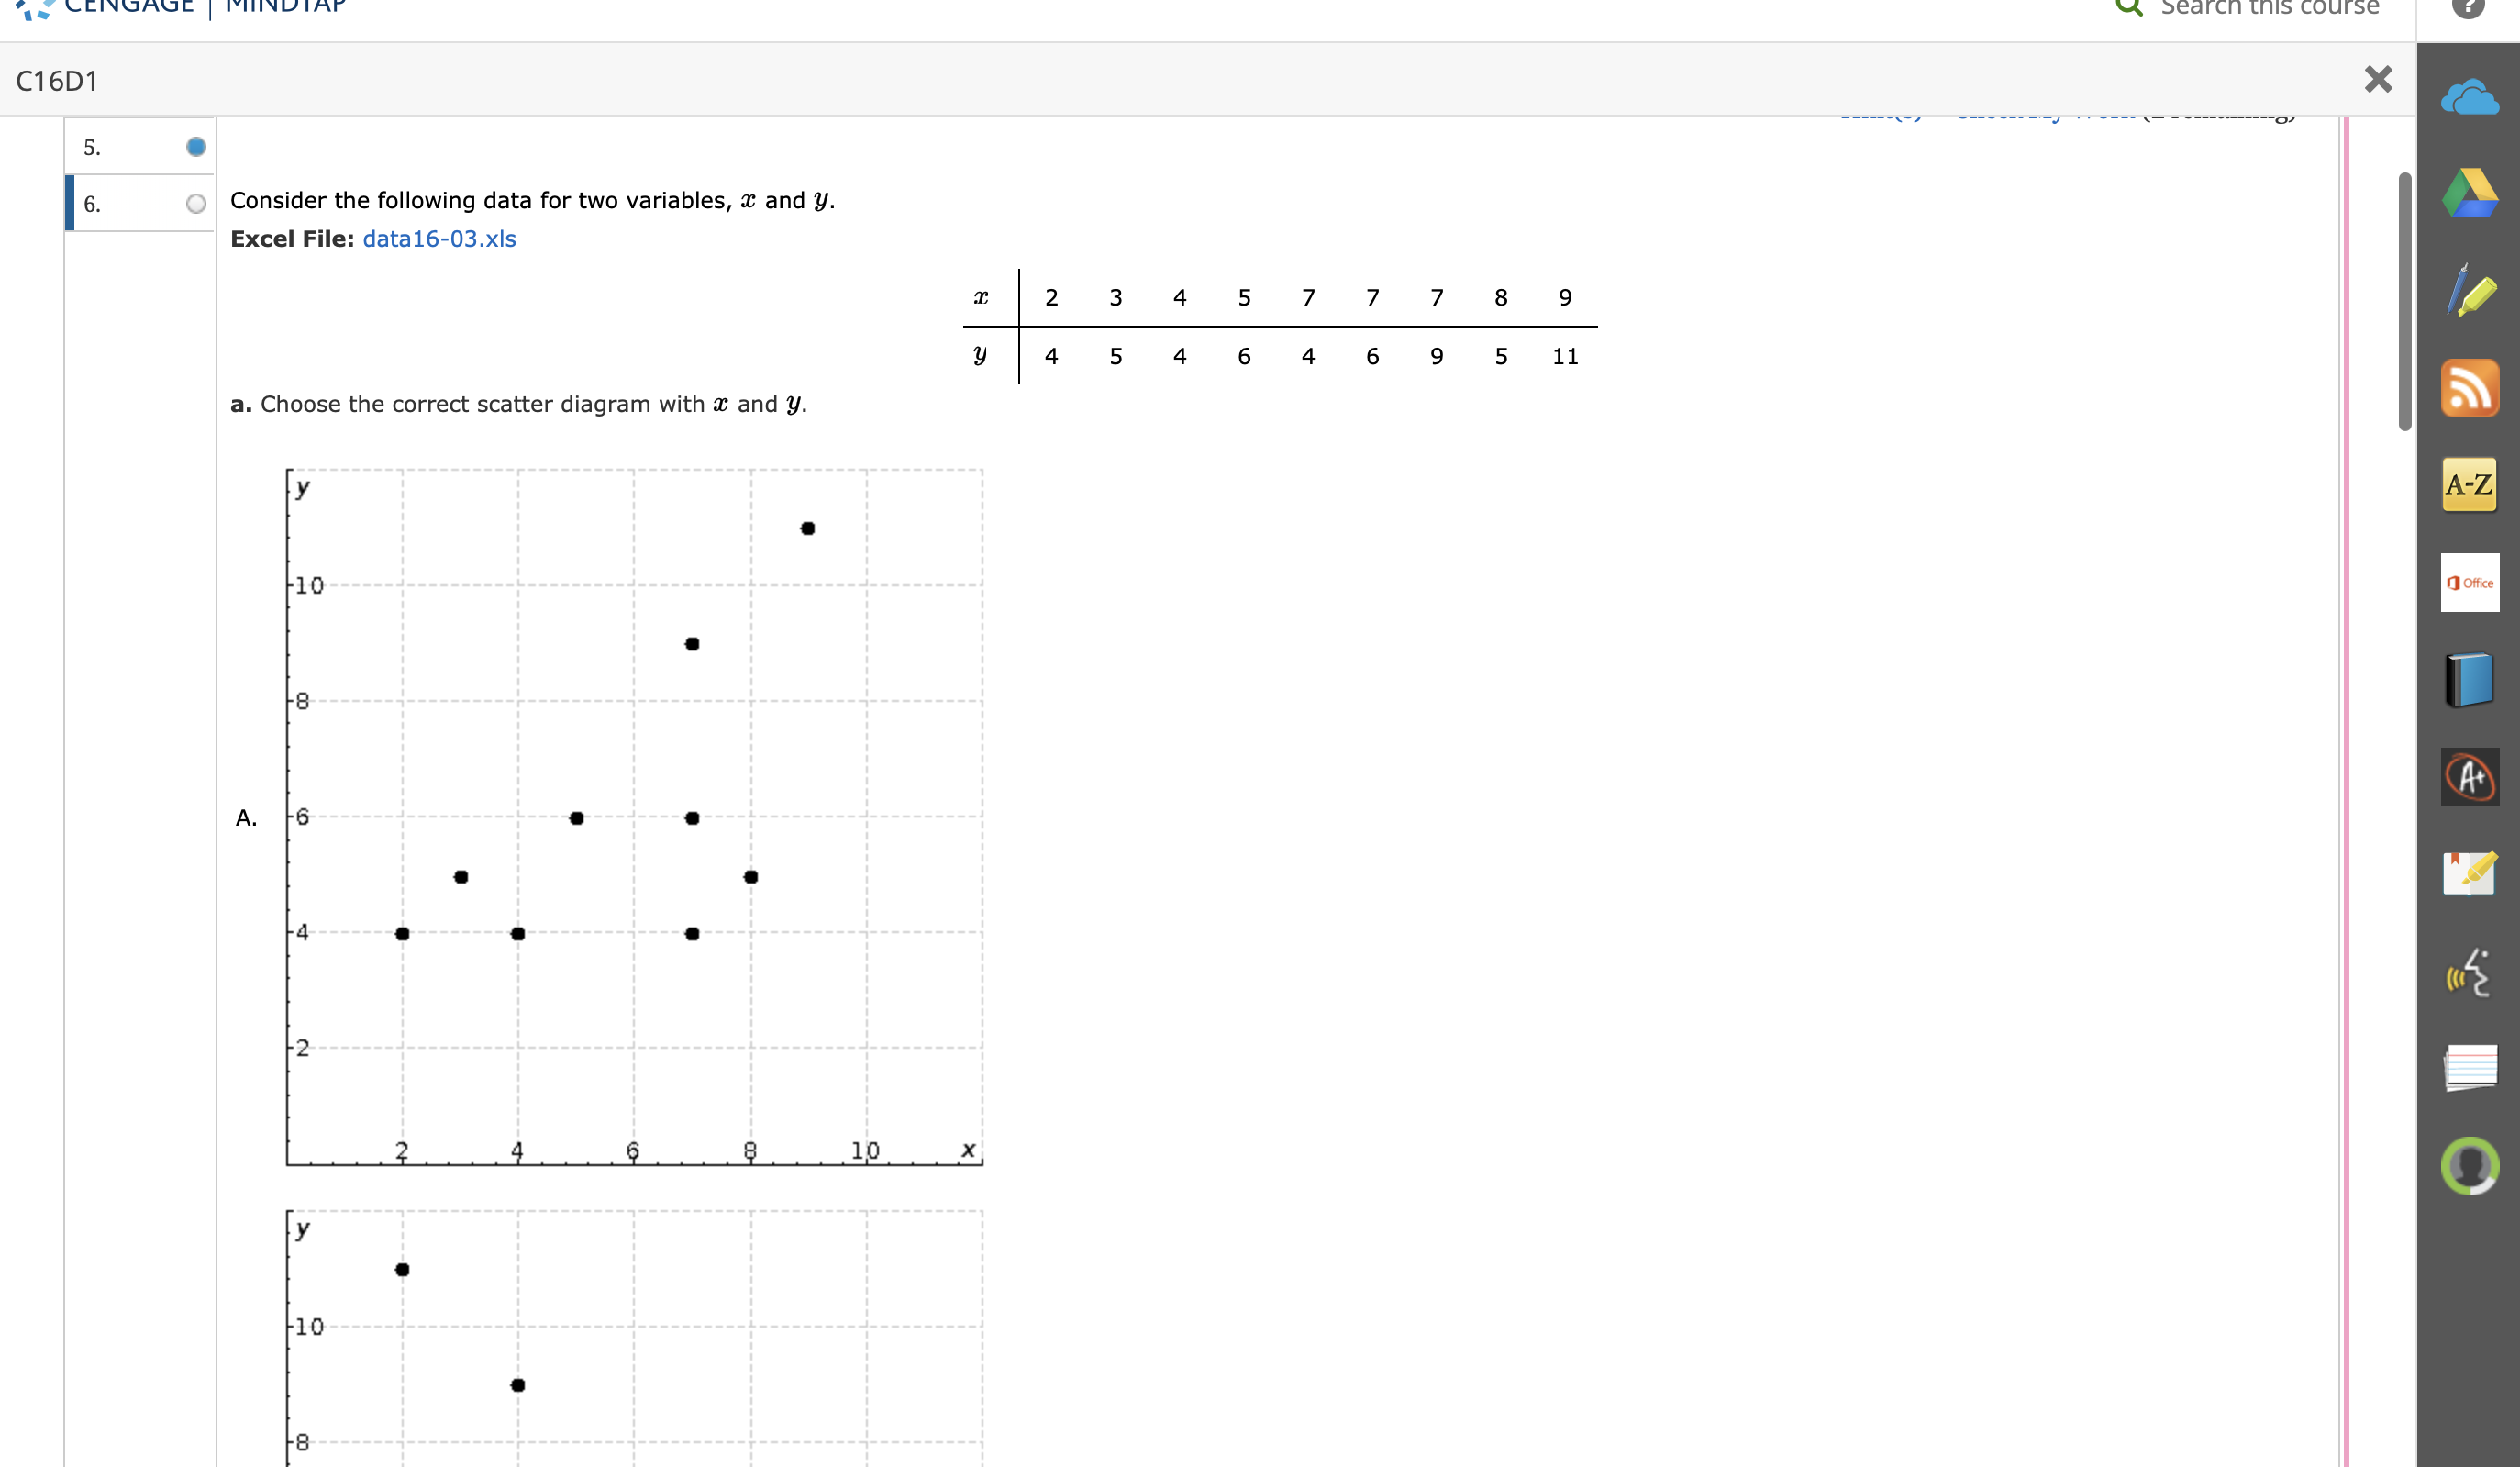
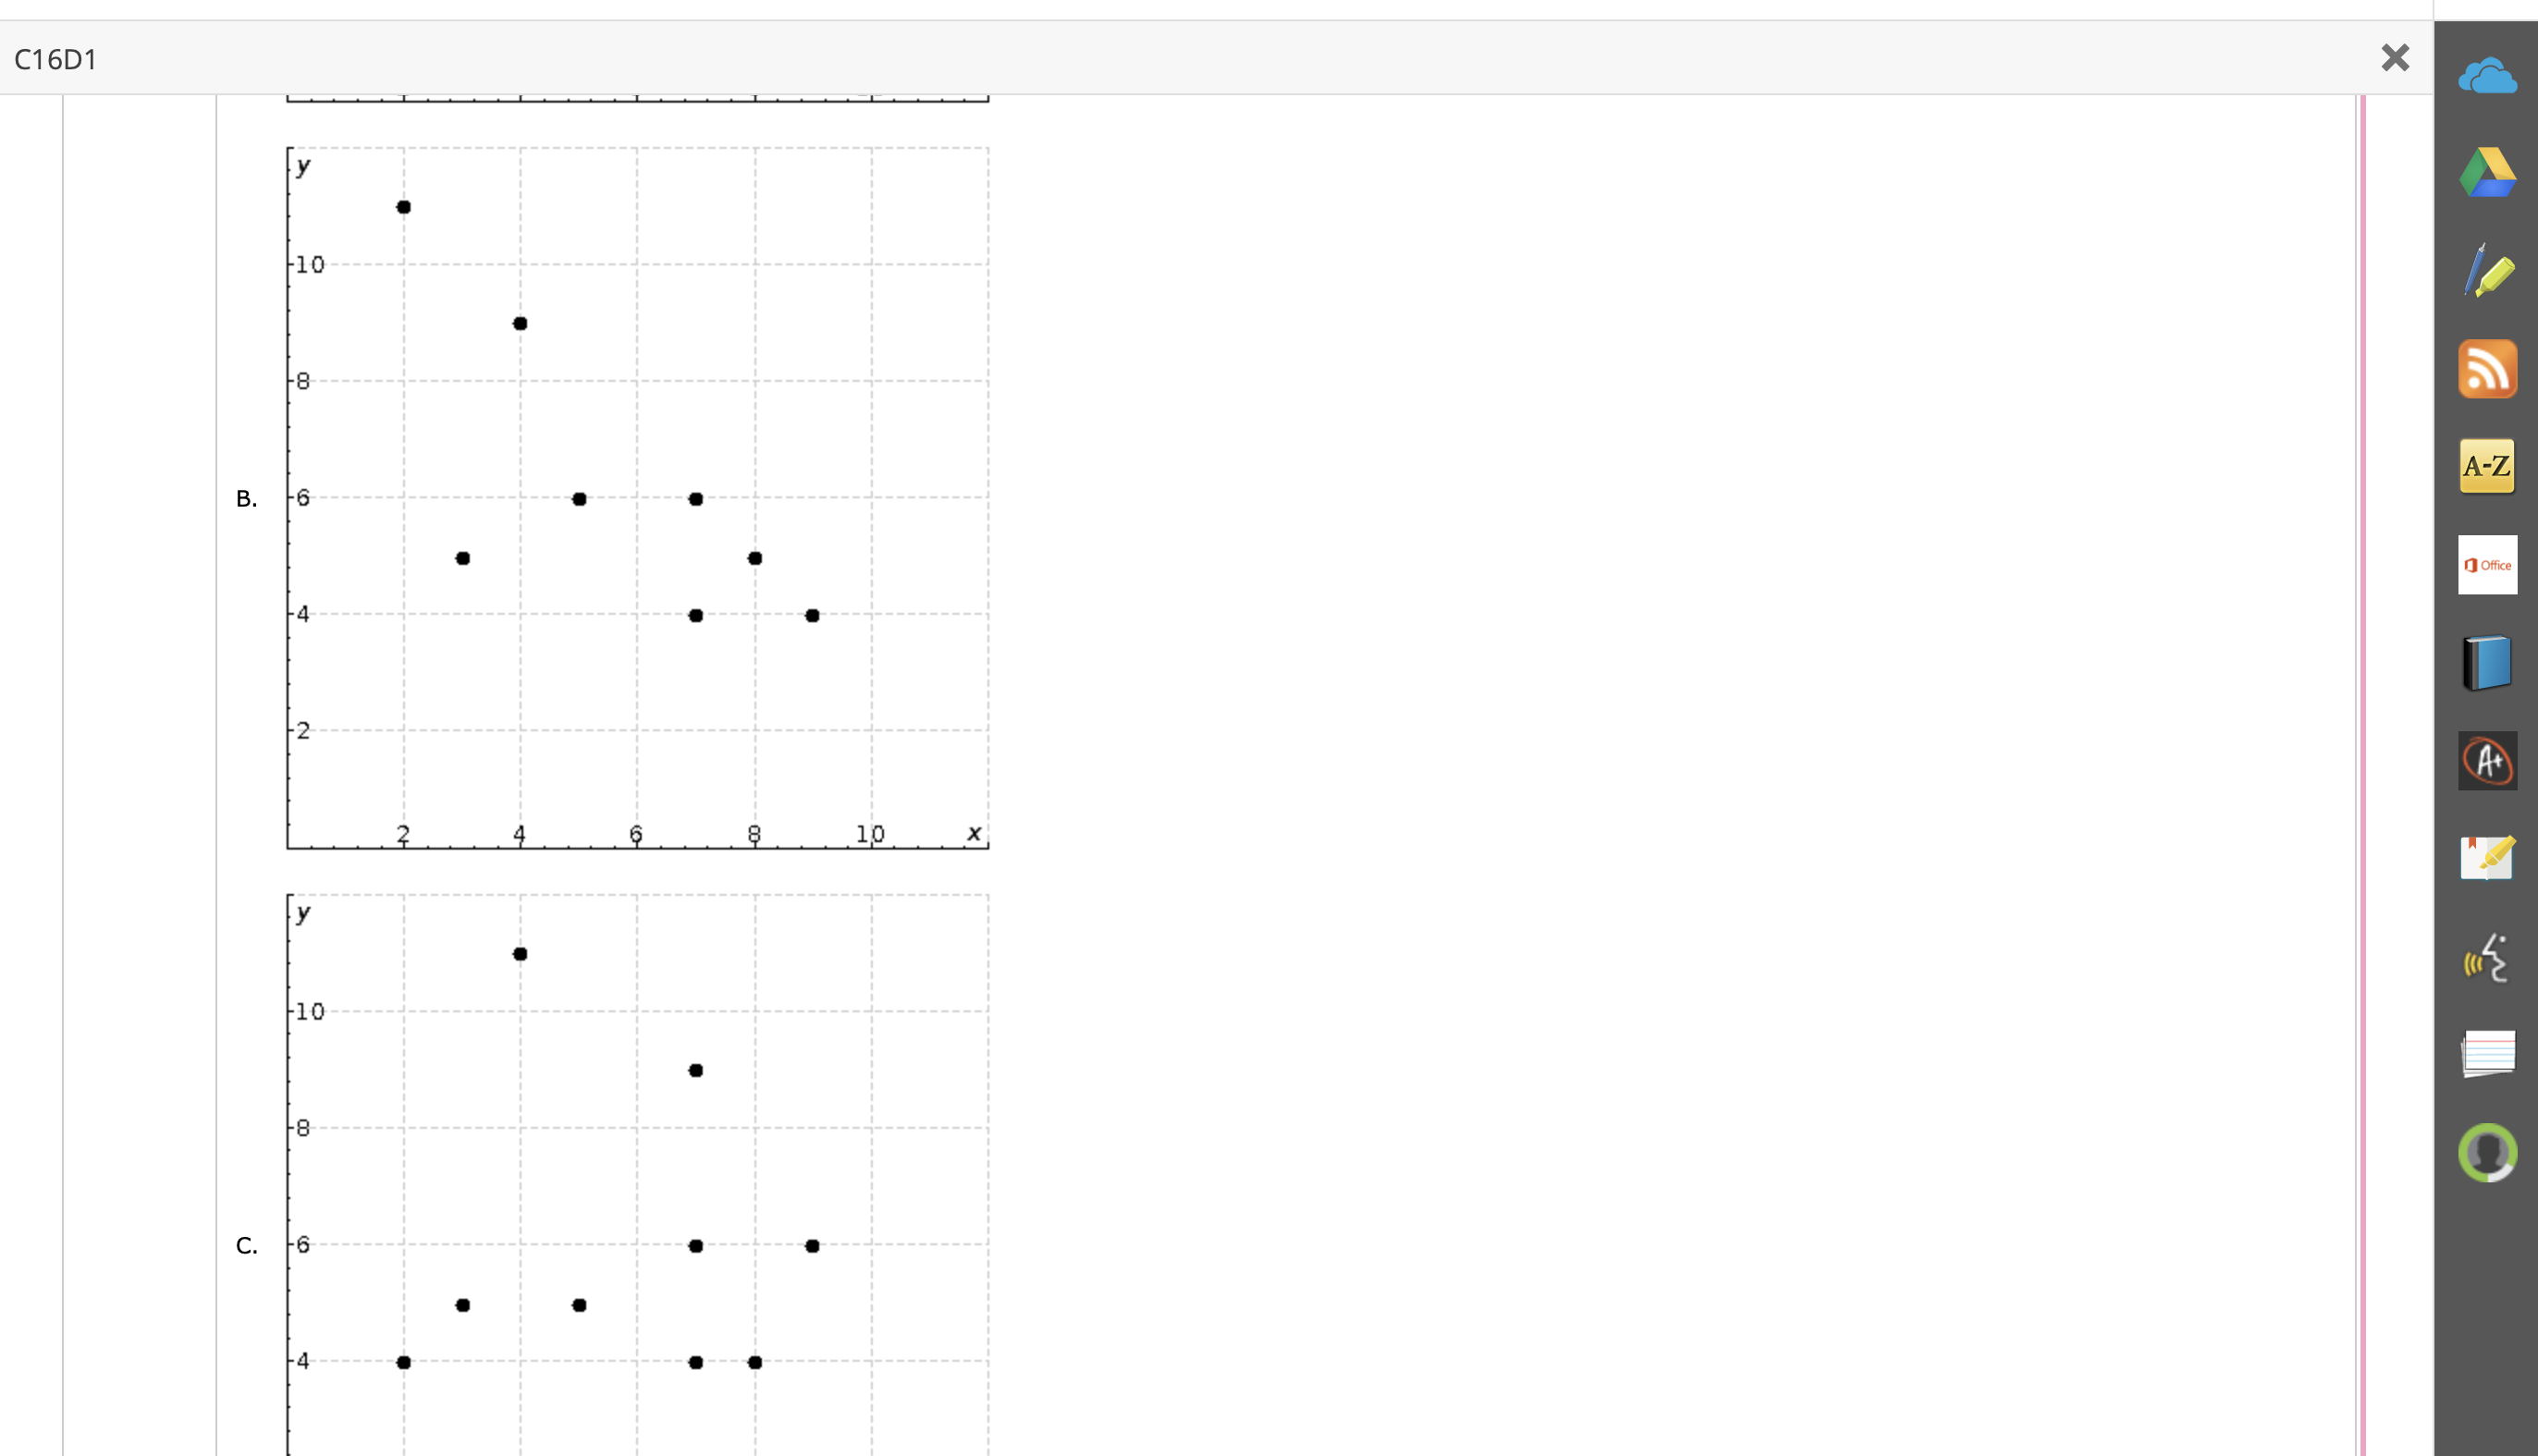
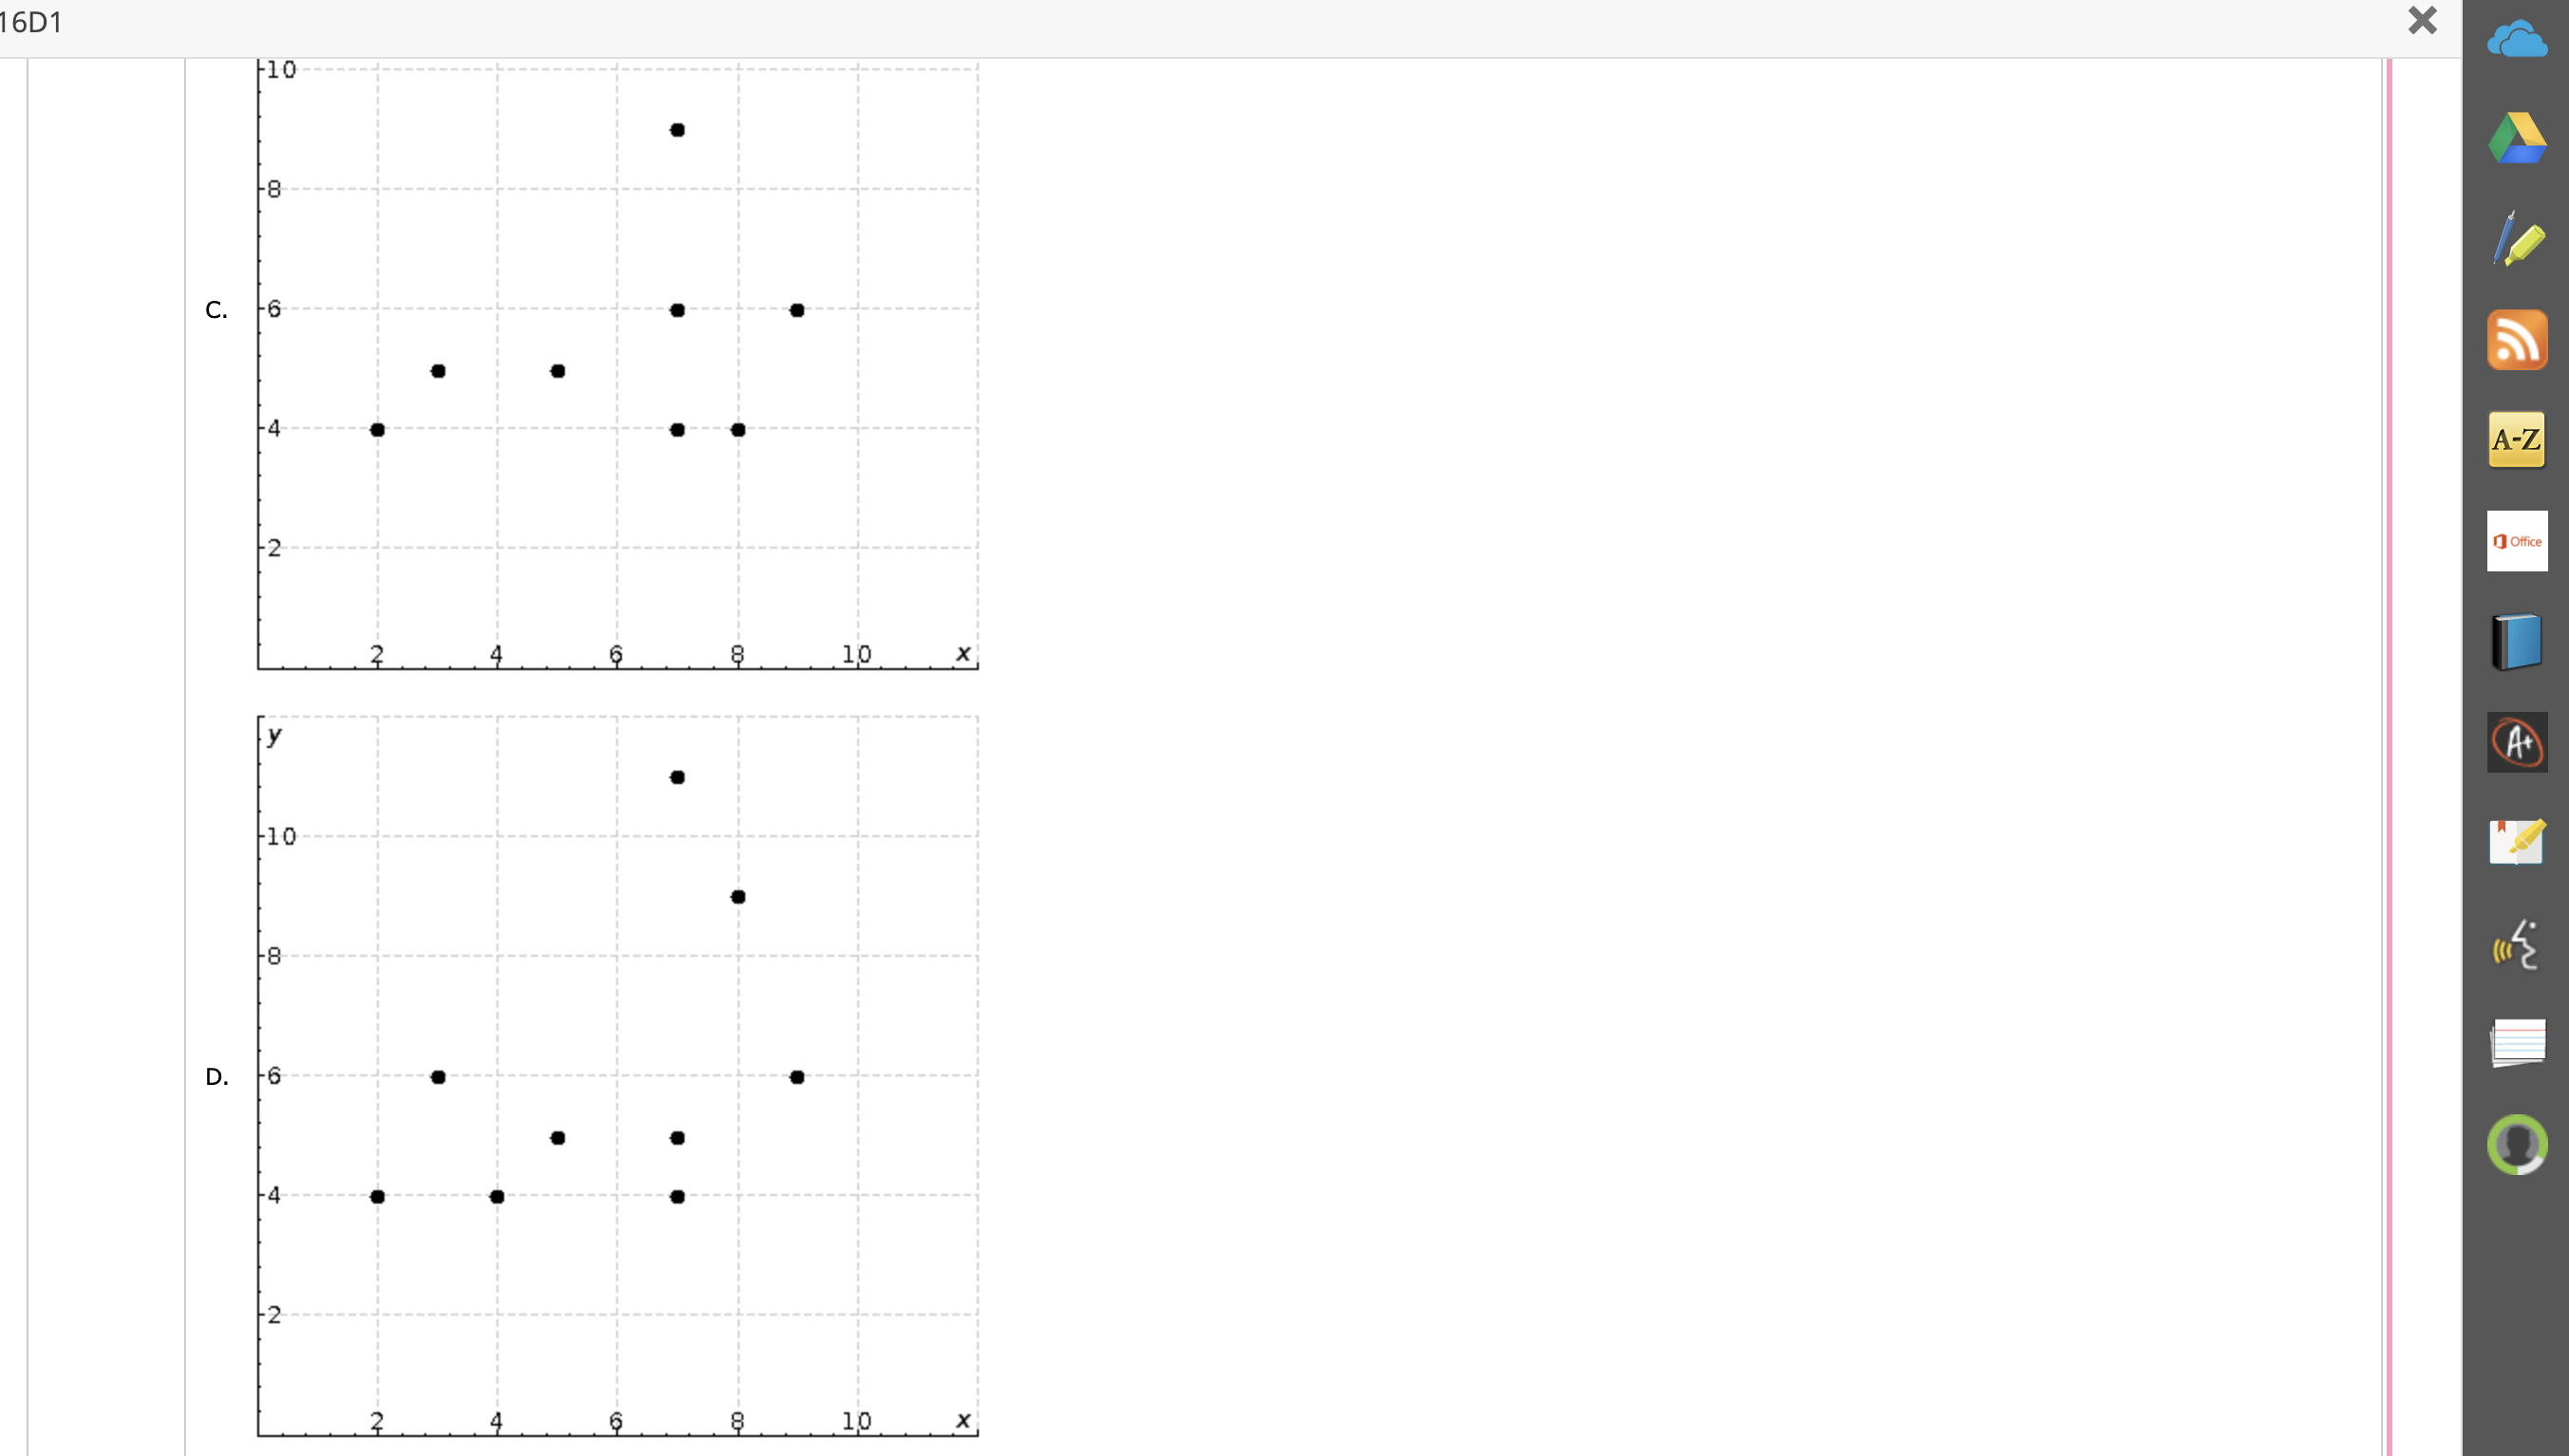
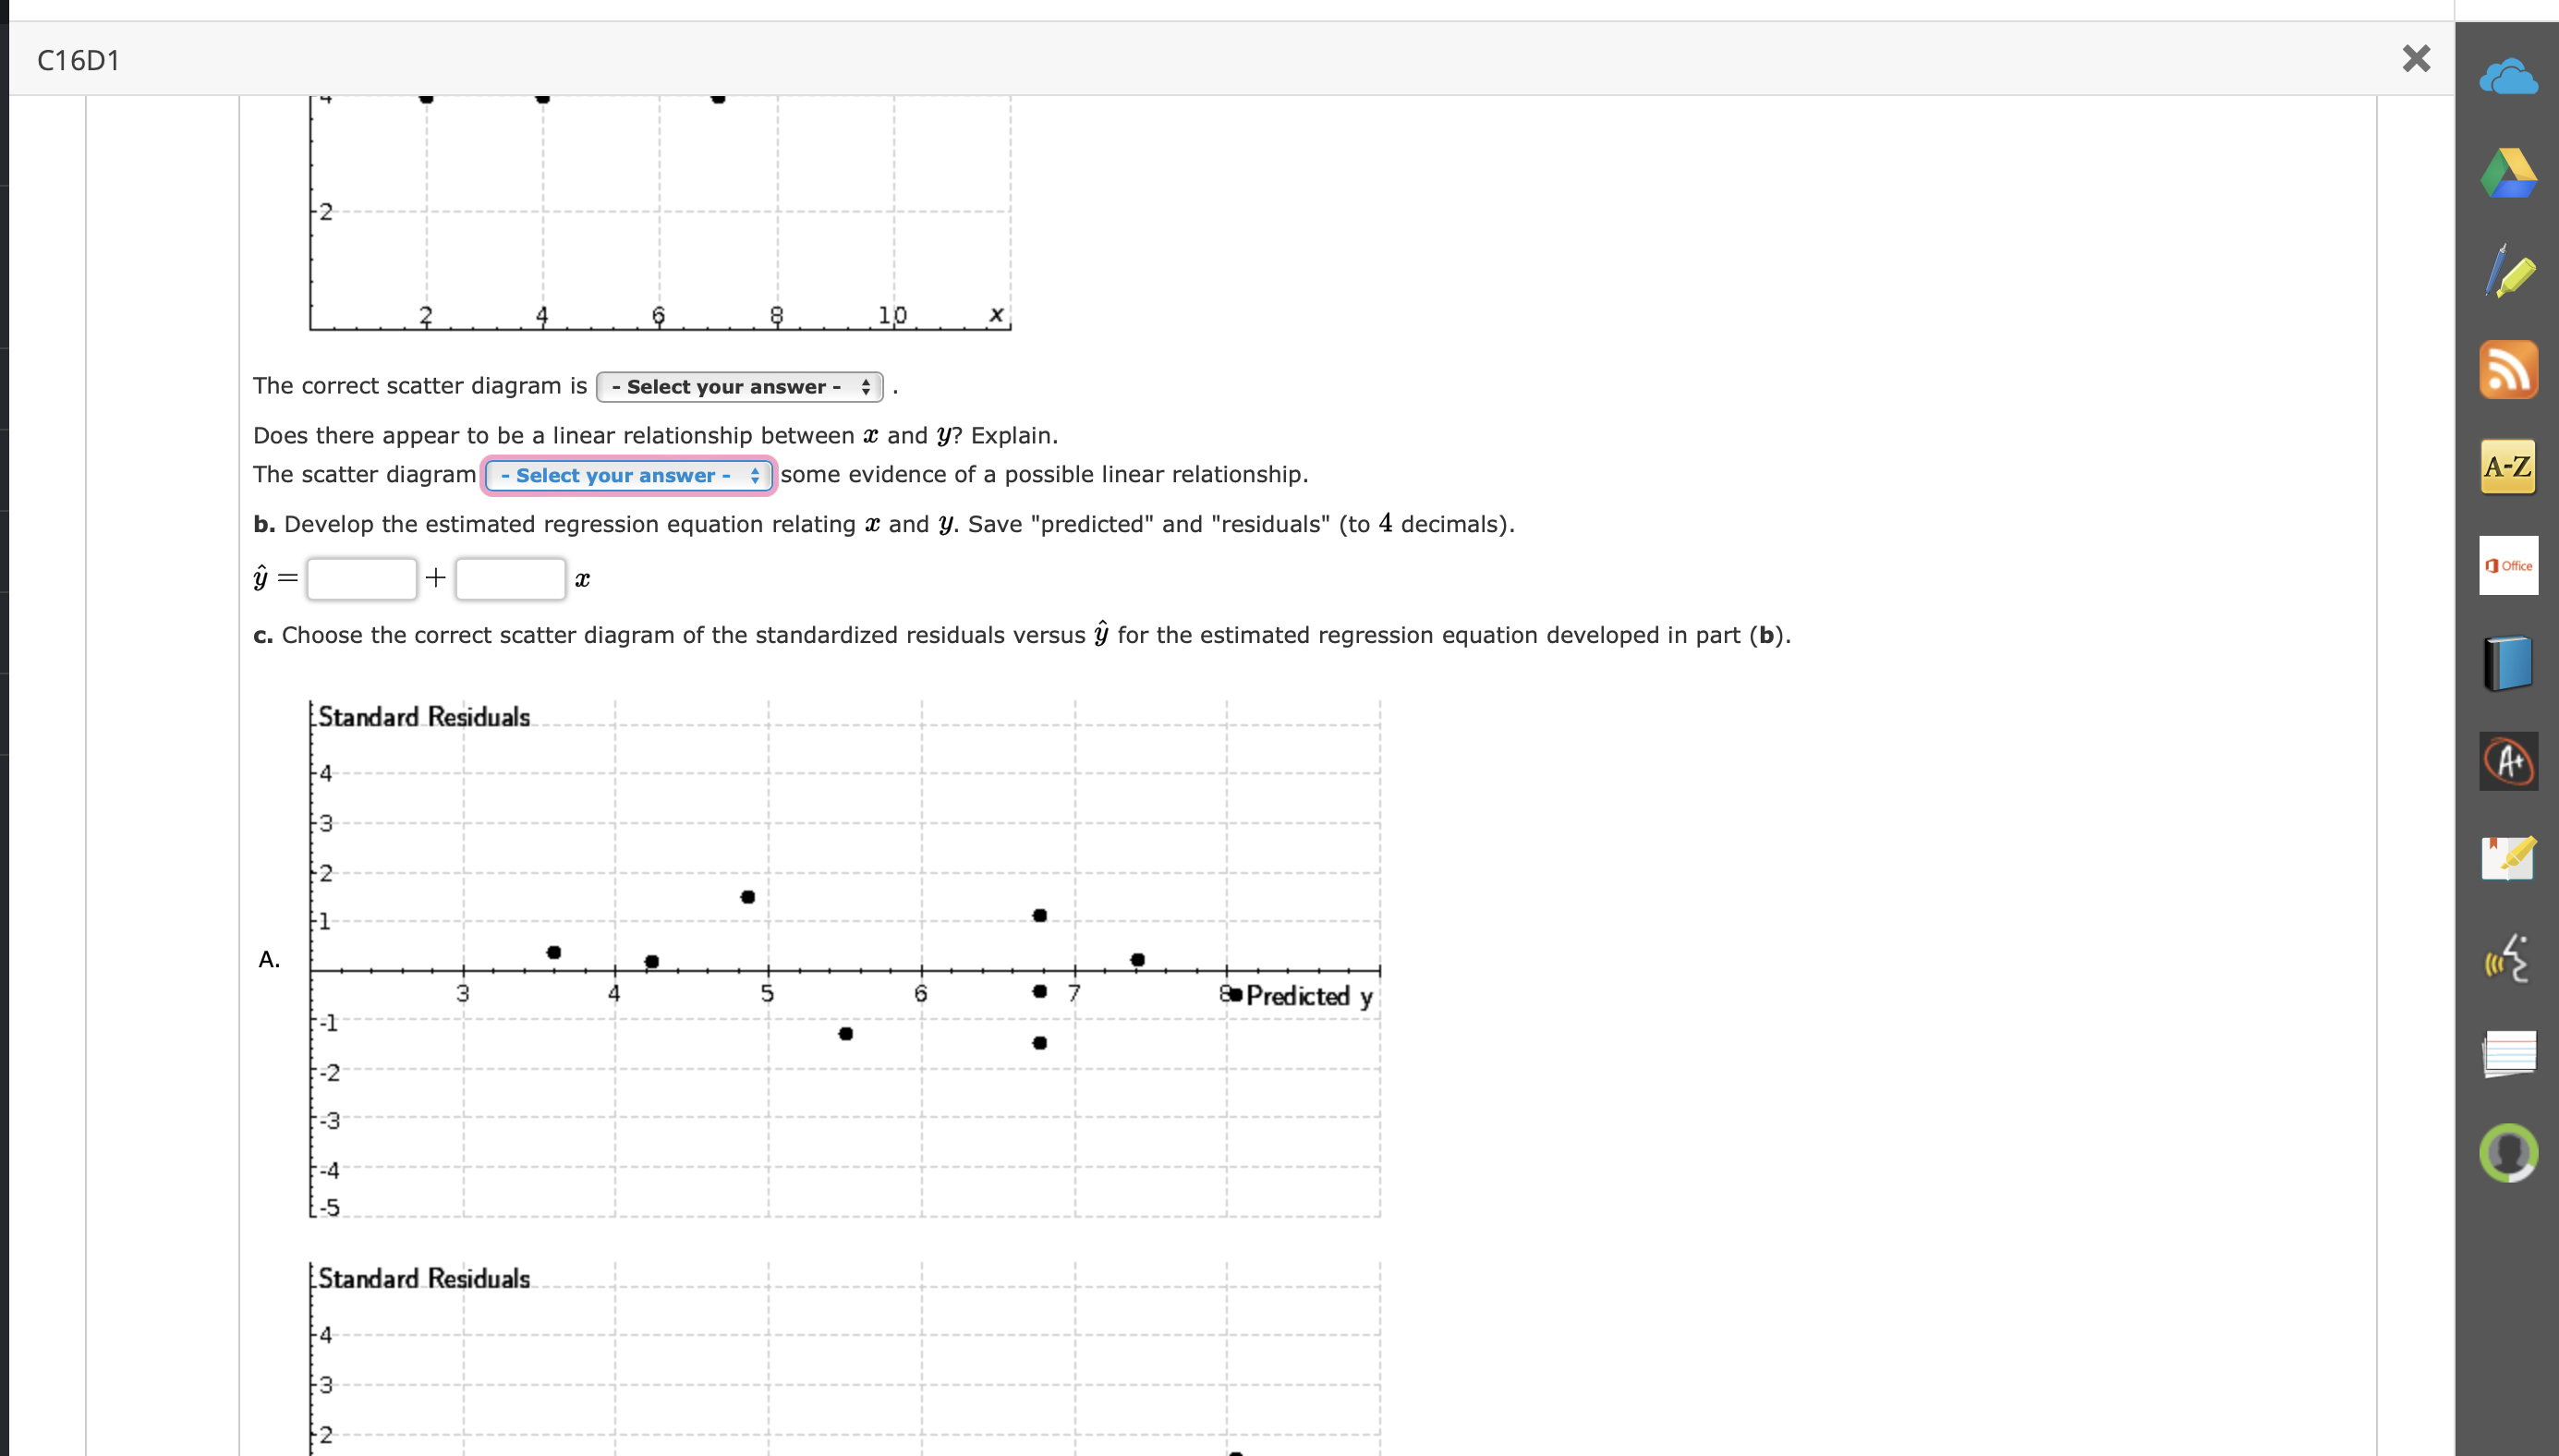
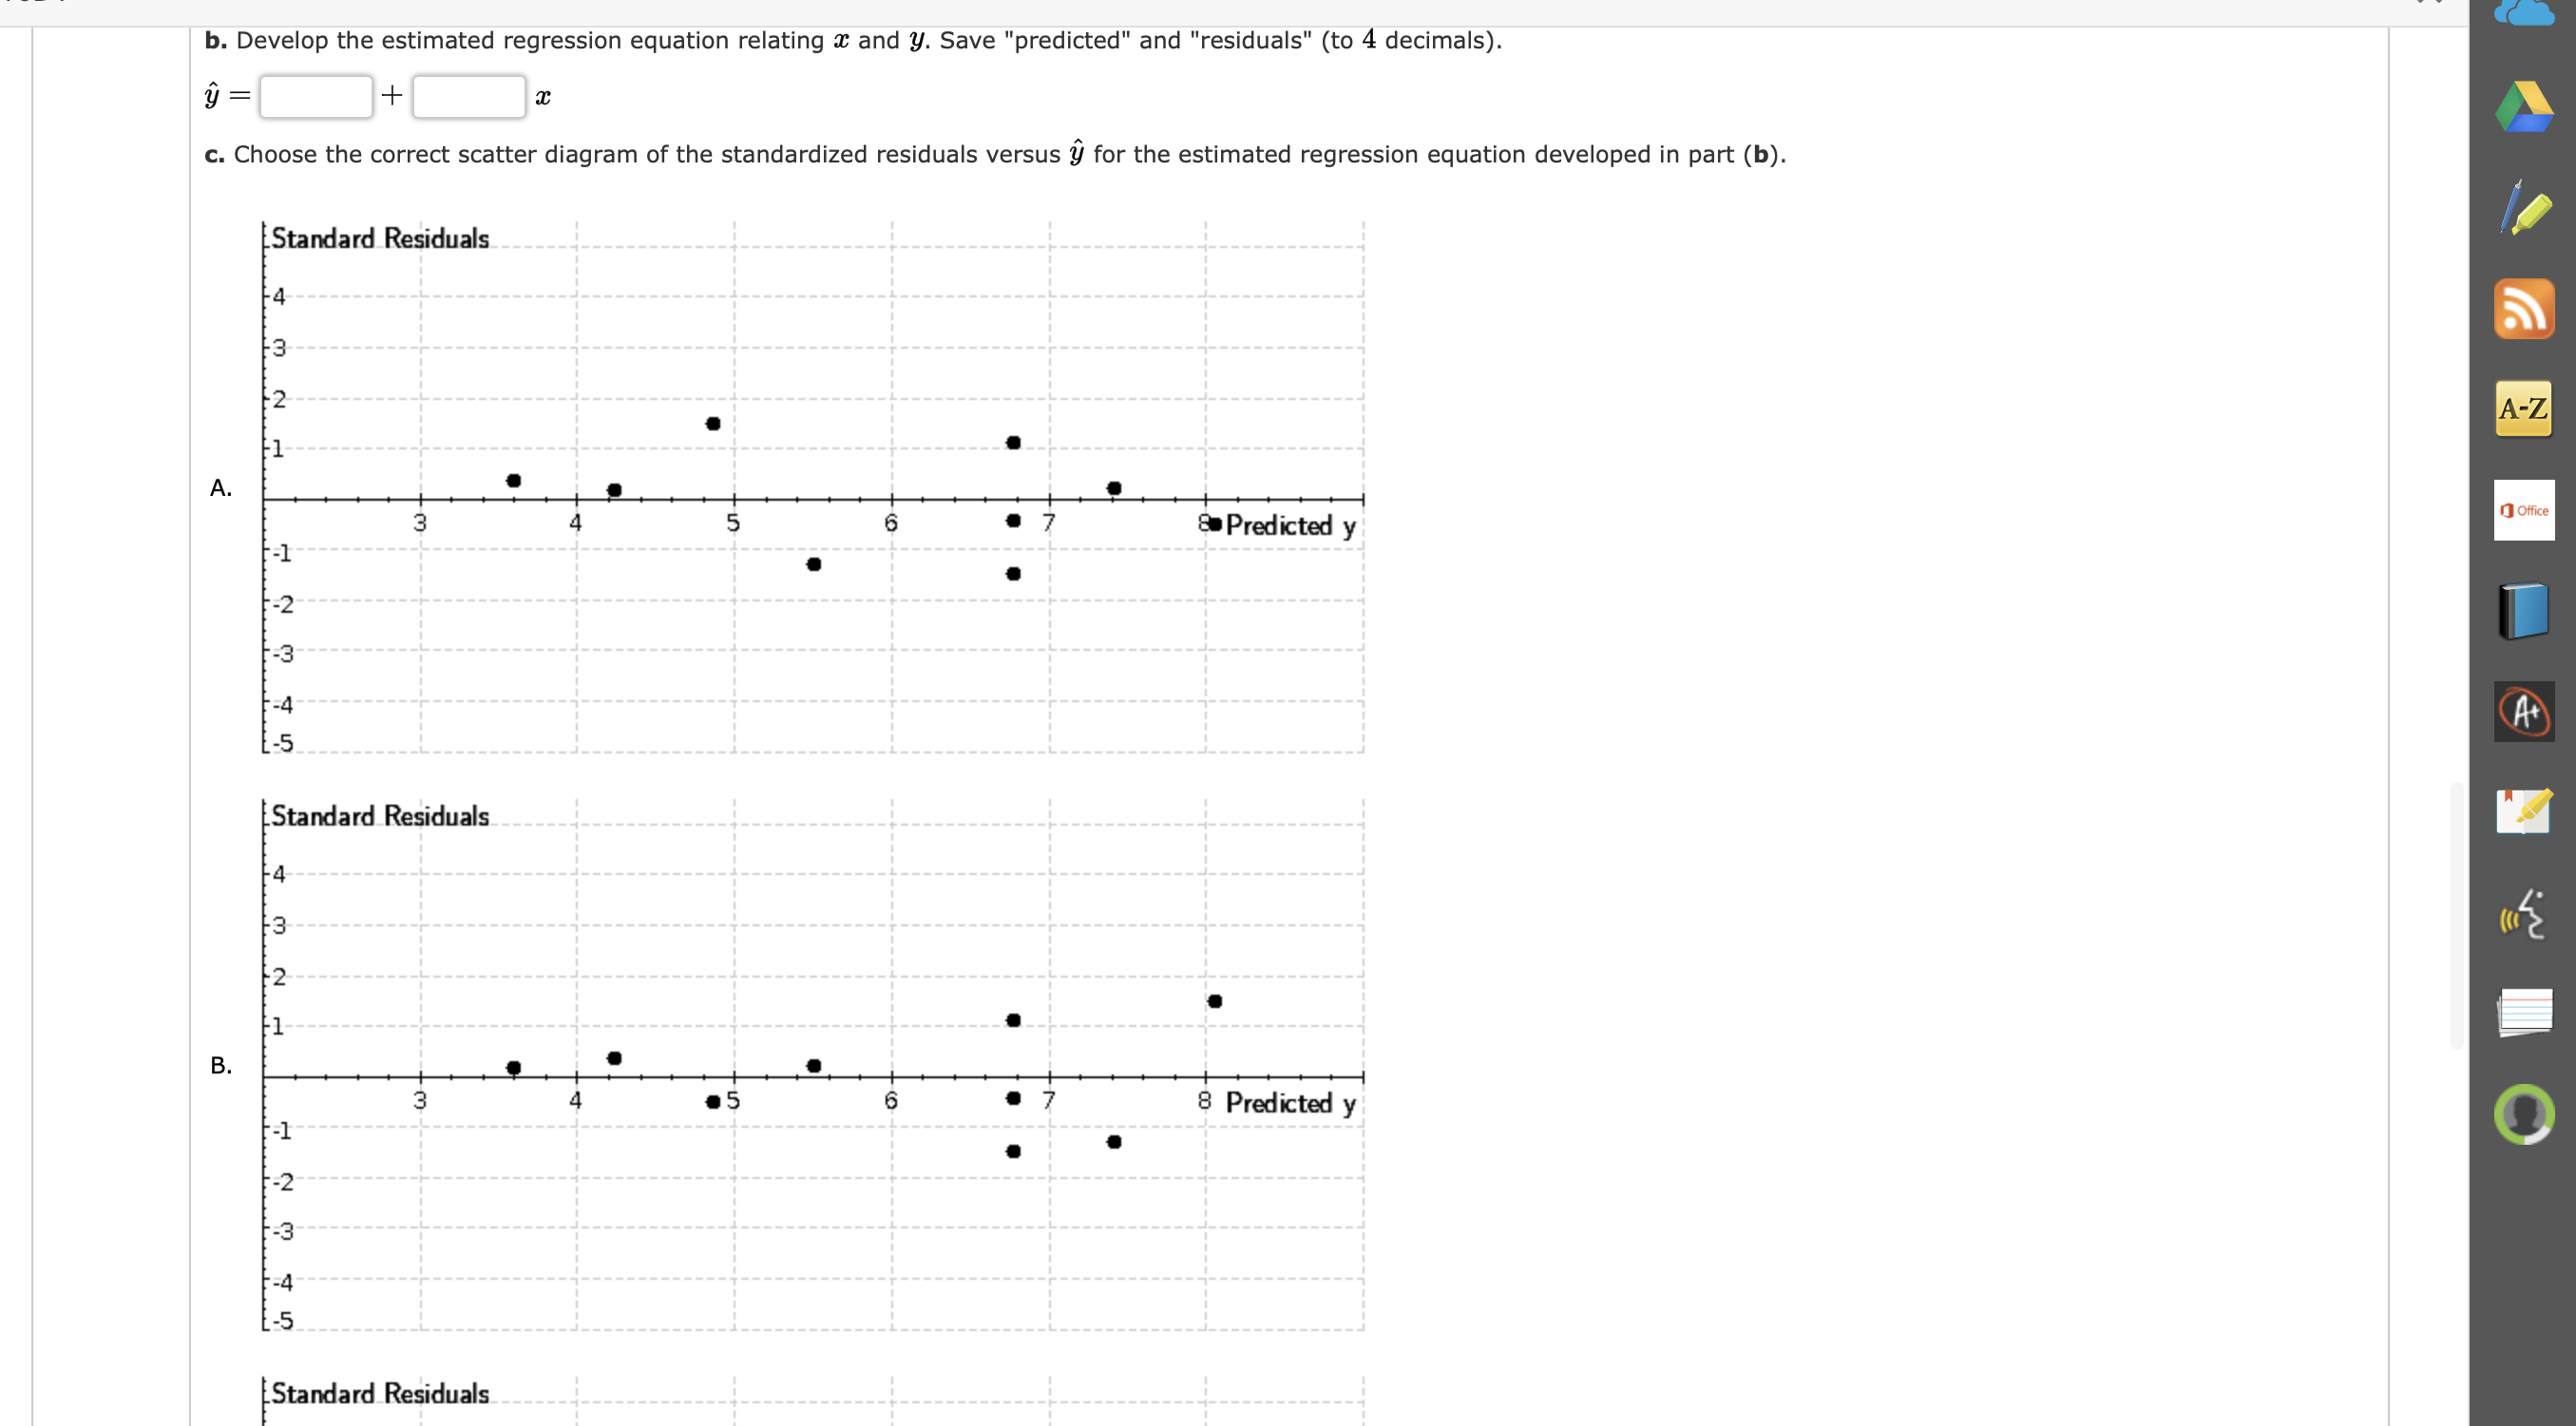
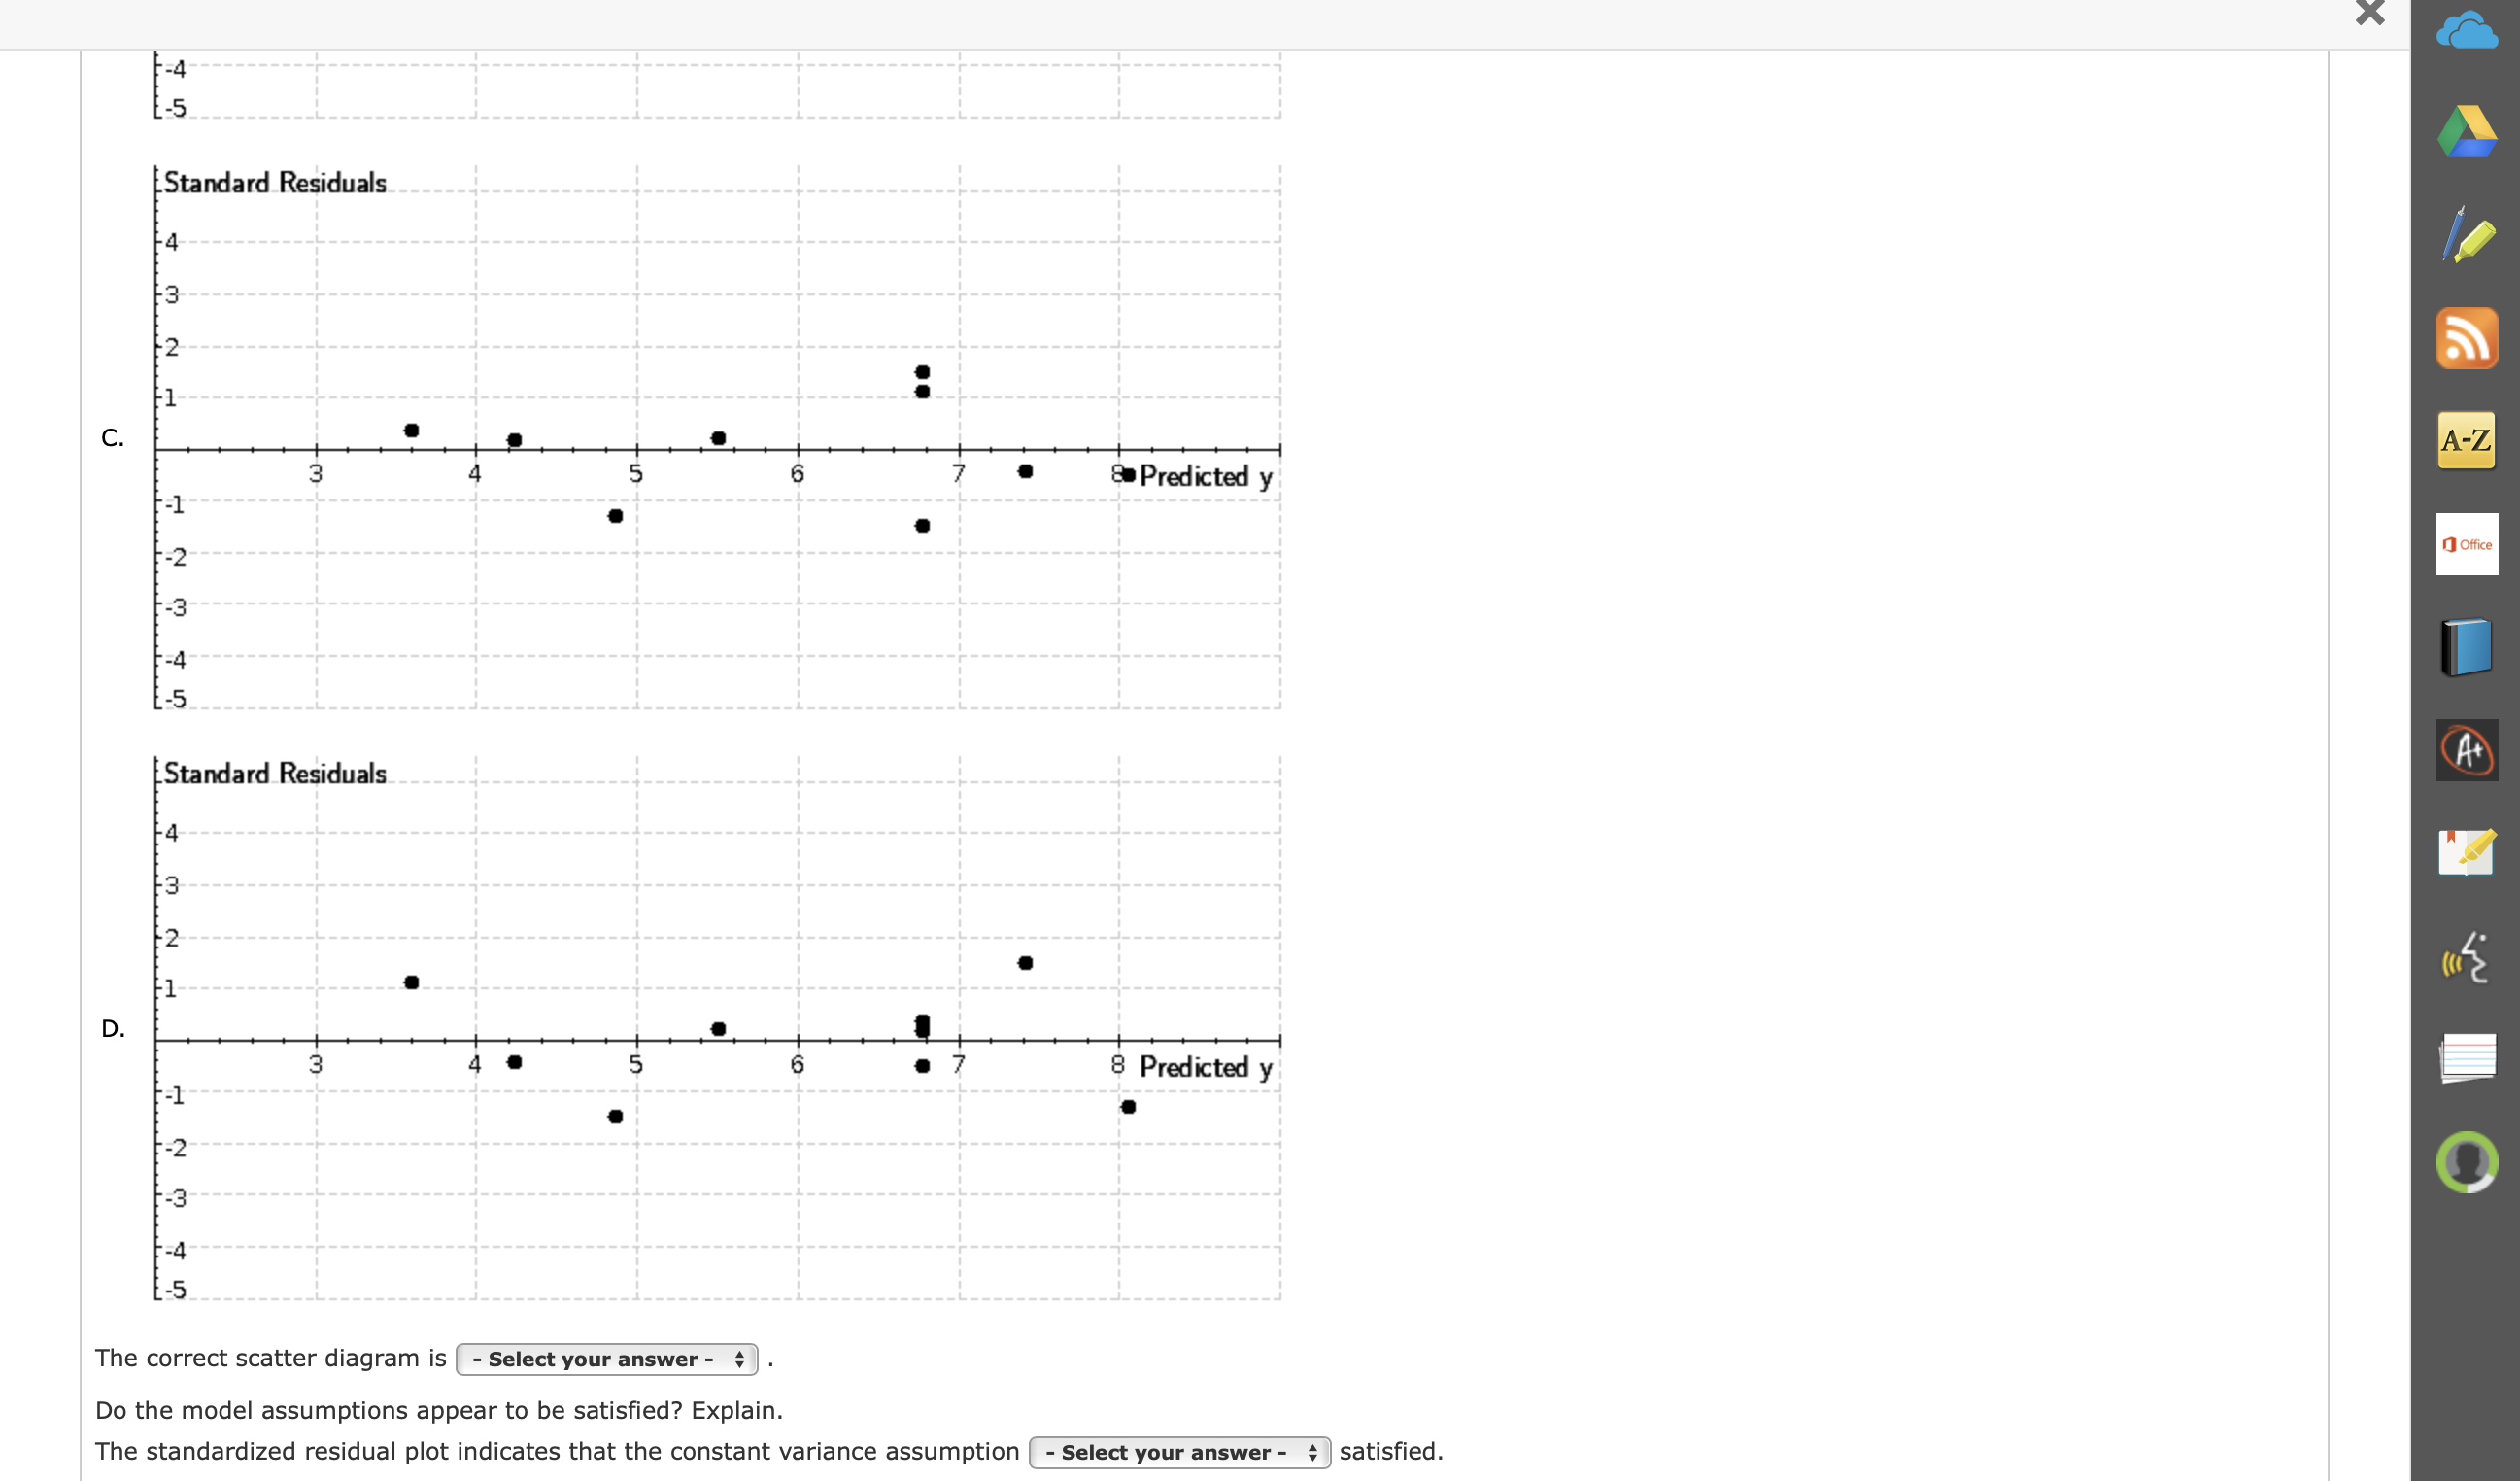
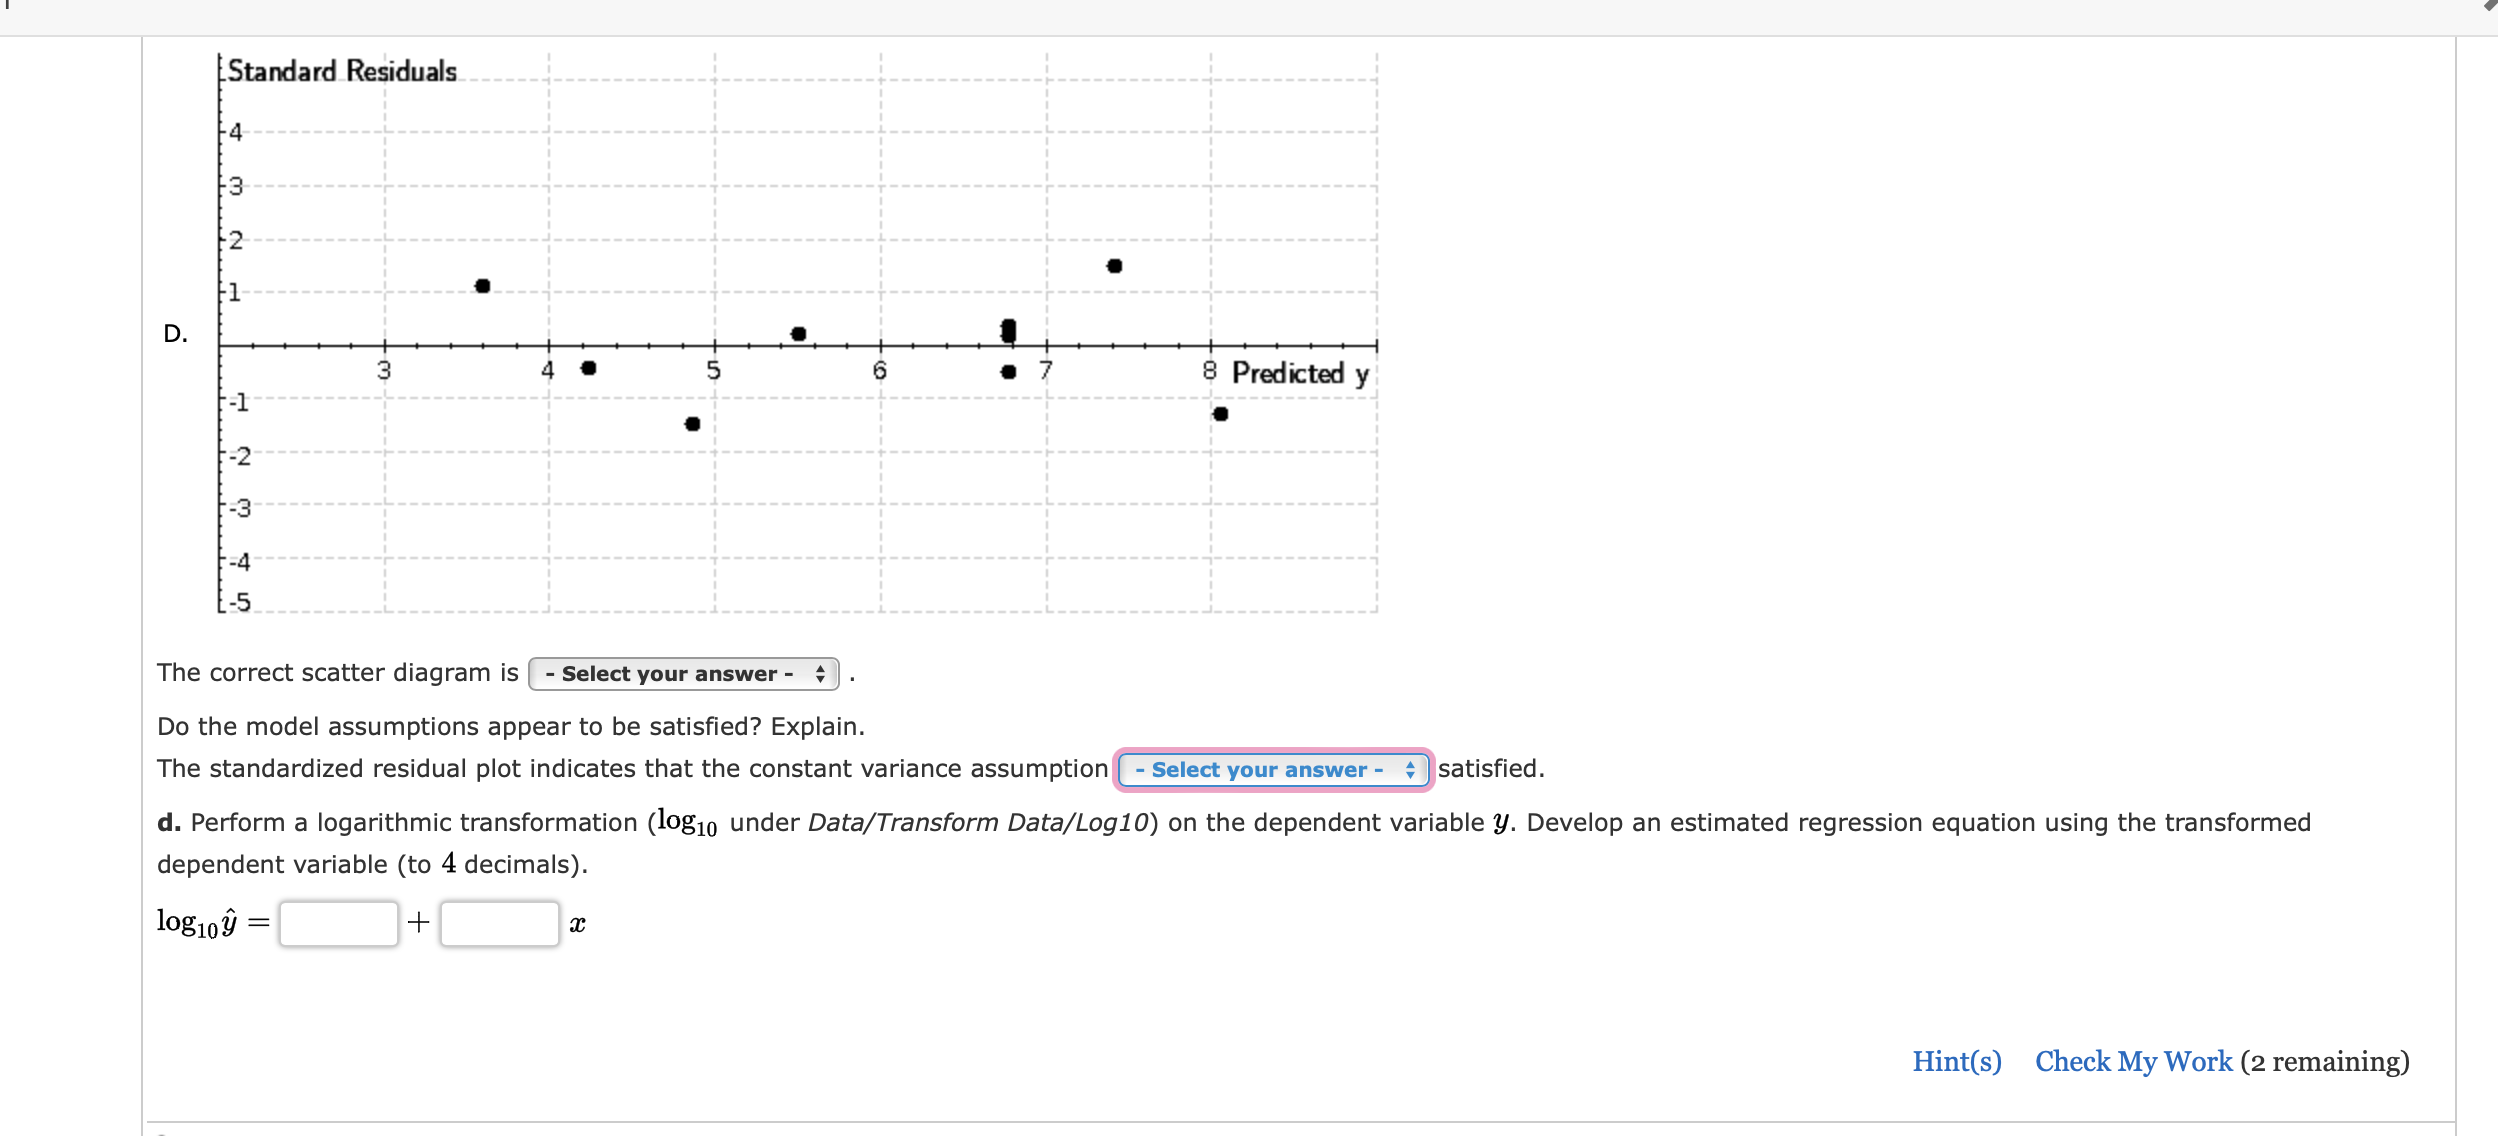
A sample containing years to maturity and yield (%) for 40 corporate bonds are contained in the table below. Company Ticker GE Years Yield 1.00 0.767 MS 1.10 1.916 WFC 1.15 0.697 TOTAL 1.75 1.378 TOTAL 3.25 1.748 GS 3.75 3.558 MS 4.00 4.413 JPM 4.25 2.310 C 4.75 3.332 RABOBK 4.75 2.805 TOTAL 5.00 2.069 MS 5.00 4.739 AXP 5.00 2.181 MTNA 5.00 4.366 BAC 5.00 3.699 VOD 5.00 1.855 SHBASS 5.00 2.861 AIG 5.00 3.452 HCN 7.00 4.184 MS 9.25 5.798 GS 9.25 5.365 GE 9.50 3.778 GS 9.75 5.367 C BAC 9.75 9.75 4.949 4.414 RABOBK 9.75 4.203 WFC 10.00 3.682 MS 5.00 4.739 AXP 5.00 2.181 MTNA 5.00 4.366 BAC 5.00 3.699 VOD 5.00 1.855 SHBASS 5.00 2.861 AIG 5.00 3.452 HCN 7.00 4.184 MS 9.25 5.798 GS 9.25 5.365 GE 9.50 3.778 GS 9.75 5.367 C 9.75 4.414 BAC 9.75 4.949 RABOBK 9.75 4.203 WFC 10.00 3.682 TOTAL 10.00 3.270 MTNA 10.00 6.046 LNC 10.00 4.163 FCX 10.00 4.030 NEM 10.00 3.866 PAA 10.25 3.856 HSBC 12.00 4.079 GS 25.50 6.913 C 25.75 8.204 GE 26.00 5.130 GE 26.75 5.138 T 28.50 4.930 BAC 29.75 5.903 a. Choose the correct scatter diagram of the data using x = years to maturity as the independent variable. A Yield +8 5 4 m B Yield F8 5 10 15 20 25 Years to Maturity C Yield F8 10 15 20 25 Years to Maturity Co A-Z Office A+ C Yield F8 D 6 [5 Yield F8 -6 5 5 10 15 20 20 - Select your answer - 25 Years to Maturity 10 15 20 25 Years to Maturity Does a simple linear regression model appear to be appropriate? - Select your answer - b. Develop an estimated regression equation with x = years to maturity and x as the independent variables (to 4 decimals). Enter negative values as negative numbers. Co A-Z Office A+ 10 15 20 25 Years to Maturity K - Select your answer - Does a simple linear regression model appear to be appropriate? - Select your answer - b. Develop an estimated regression equation with x = years to maturity and a as the independent variables (to 4 decimals). Enter negative values as negative numbers. YearsSq Yield = + Years + What is the value of the coefficient of determination? Note: Report R between 0 and 1. A-Z Office (to 3 decimals) What is the value of the F test statistic? (to 2 decimals) What is the p-value? If your answer is zero enter "0". (to 4 decimals) c. As an alternative to fitting a second-order model, fit a model using the natural logarithm of x as the independent variable; that is, Yield = + In(Years) What is the value of the coefficient of determination? Note: Report R between 0 and 1. (to 3 decimals) < = bob ln(x) (to 3 decimals). What is the value of the F test statistic? (to 2 decimals) What is the p-value? If your answer is zero enter "0". (to 4 decimals) Does estimated regression using natural logarithm of x provide a better fit than estimated regression equation developed in part (b)? Explain. - Select your answer - because R-Sq for the logarithmic model - Select your answer - higher than R-Sq (adj) for the second-order model. ' Hint(s) Check My Work (2 remaining) A+ 5. 6. Consumer Reports tested 19 different brands and models of road, fitness, and comfort bikes. Road bikes are designed for long road trips; fitness bikes are designed for regular workouts or daily commutes; and comfort bikes are designed for leisure rides on typically flat roads. The following data show the type, weight (lb.), and price ($) for the 19 bicycles tested. Click on the datafile logo to reference the data. DATA file 4. Co Brand and Model Weight Price Klein Reve V Road 20 1800 A-Z Giant OCR Composite 3 Road 22 1800 Giant OCR 1 Road 22 1000 Office Specialized Roubaix Road 21 1300 Trek Pilot 2.1 Road 21 1320 Cannondale Synapse 4 Road 21 1050 LeMond Poprad Road 22 1350 Raleigh Cadent 1.0 Road 24 650 A+ Giant FCR3 Fitness Schwinn Super Sport GS Fitness Fuji Absolute 2.0 Fitness Jamis Coda Comp Fitness Cannondale Road Warrior 400 Fitness 22222 23 630 23 700 24 700 26 830 25 700 Schwinn Sierra GS Comfort 31 340 Mongoose Switchback SX Comfort 32 280 Giant Sedona DX Comfort 32 360 Jamis Explorer 4.0 Comfort 35 600 Diamondback Wildwood Deluxe Comfort 34 350 Specialized Crossroads Sport Comfort 31 330 a. Select an appropriate scatter diagram with weight as the independent variable and price as the dependent variable. 1. [Price ($) F1800 a. Select an appropriate scatter diagram with weight as the independent variable and price as the dependent variable. 1. [Price ($) F1800 [1600 F1400 F1200 F1000 F800 [600 F400 200 2. [Price ($) F1800 F1600 F1400 1200 F1000 [800 [600 F400 200 3. [Price ($) 1800 F1600 1400 20 25 30 35 Weight (lb.) 20 25 30 35 Weight (lb.) e A-Z Office A+ 3. [Price ($) F1800 F1600 F1400 F1200 F1000 F800 F600 F400 F200 4. [Price ($) F1800 F1600 F1400 F1 200 F1000 20 25 25 30 35 20 25 30 35 F800 F600 : [400 F200 20 25 30 35 Select the correct scatter diagram from the options above. - Select your answer - Does a simple linear regression model appear to be appropriate? Select your answer - Weight (lb.) A-Z Office Weight (lb.) A+ Weight (lb.) F400 200 20 25 30 35 Weight (lb.) Select the correct scatter diagram from the options above. - Select your answer - Does a simple linear regression model appear to be appropriate? - Select your answer - Round your answers to four decimal places. b. Develop an estimated multiple regression equation with x = = Weight + = Weight and x2 = WeightSq as the two independent variables. WeightSq c. Use the following dummy variables to develop an estimated regression equation that can be used to predict the price given the type of bike: Type_Fitness: bike, 0 otherwise; and Type_Comfort 1 if the bike is a comfort bike; 0 otherwise. Compare the results obtained to the results obtained in part (b). Type Fitness - = Type of bike appears to be a(n) - Select your answer - fit. Type_Comfort Offic = 1 if the bike is a fitness Select your answer - factor in predicting price. But, the estimated regression equation developed in part (b) appears to provide a slightly d. To account for possible interaction between the type of bike and the weight of the bike, develop a new estimated regression equation that can be used to predict the price of the bike given the type, the weight of the bike, and any interaction between weight and each of the dummy variables defined in part (c). What estimated regression equation appears to be the best predictor of price? Please round to four decimal places. = Weight - Type_Fitness - Type_Comfort + WxF + WxC Hint(s) Check My Work (2 remaining) C16D1 5. 6. Consider the following data for two variables, x and y. Excel File: data16-03.xls a. Choose the correct scatter diagram with x and y. -10 8 A. -6 10 F8 00- 10 I 2 6 4 34577789 5 4 6 4 6 95 11 Search this course Co A-Z Office A+ C16D1 10 8 B. -6 N > 10 -8 C. -6 10 X A-Z Office A+ 16D1 F10 00 8 C. -6 10 -8 D. F6 4 8 4 6 8 A-Z Office 10 A+ 10 O C16D1 8 10 The correct scatter diagram is - Select your answer - Does there appear to be a linear relationship between x and y? Explain. The scatter diagram - Select your answer - some evidence of a possible linear relationship. b. Develop the estimated regression equation relating x and y. Save "predicted" and "residuals" (to 4 decimals). = + x c. Choose the correct scatter diagram of the standardized residuals versus for the estimated regression equation developed in part (b). Standard Residuals -4 F3 A. H -1 -31 -4 3 5 6 7 8. Predicted y Standard Residuals -4 3 N A-Z Office A+ B. b. Develop the estimated regression equation relating x and y. Save "predicted" and "residuals" (to 4 decimals). = + x c. Choose the correct scatter diagram of the standardized residuals versus for the estimated regression equation developed in part (b). Standard Residuals A. -4 3 WN 4 75 Standard Residuals -4 3 7 75 Standard Residuals 4 5 5 6 Predicted y 8 Predicted y A-Z Office A+ 75 C. Standard Residuals 2 -21 D. Standard Residuals 2 -1 -21 : Office A-Z 8. Predicted y 8 Predicted y The correct scatter diagram is - Select your answer - Do the model assumptions appear to be satisfied? Explain. The standardized residual plot indicates that the constant variance assumption - Select your answer - satisfied. A+ D. Standard Residuals -3 -41 5 8 Predicted y The correct scatter diagram is - Select your answer - Do the model assumptions appear to be satisfied? Explain. + satisfied. The standardized residual plot indicates that the constant variance assumption - Select your answer - d. Perform a logarithmic transformation (log 10 under Data/Transform Data/Log10) on the dependent variable y. Develop an estimated regression equation using the transformed dependent variable (to 4 decimals). log 10 = + x Hint(s) Check My Work (2 remaining)
Step by Step Solution
There are 3 Steps involved in it

Get step-by-step solutions from verified subject matter experts