

Question: A scatter plot is drawn using a data set. Find the equation of the curve of best fit (round to two decimal places) and then
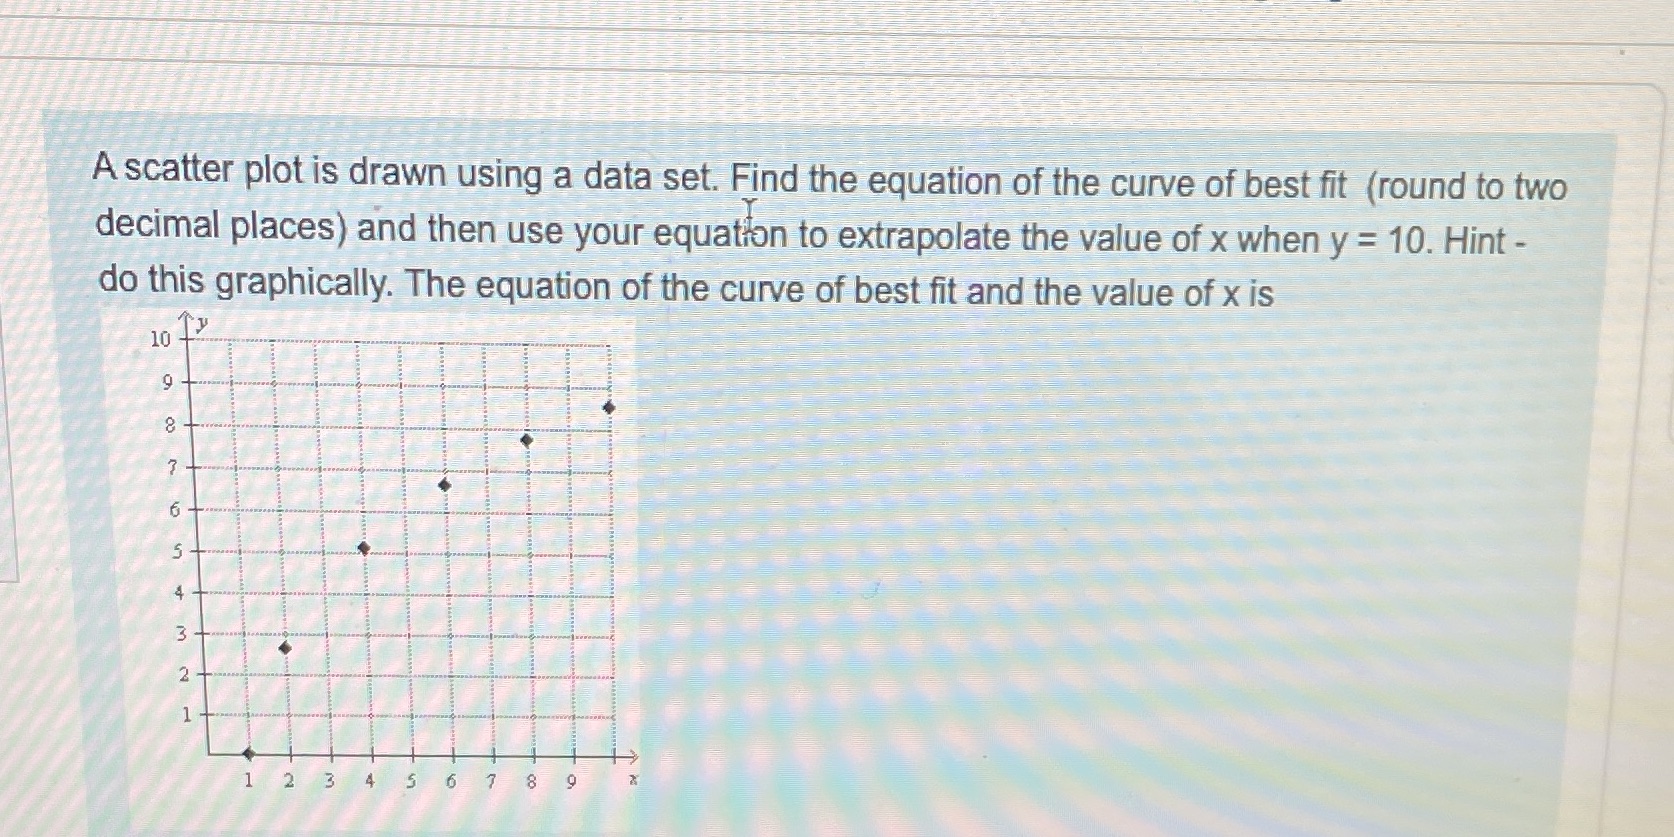
A scatter plot is drawn using a data set. Find the equation of the curve of best fit (round to two decimal places) and then use your equation to extrapolate the value of x when y = 10. Hint - do this graphically. The equation of the curve of best fit and the value of x is 10 1 2 3 4 6 7 8
Step by Step Solution
There are 3 Steps involved in it
1 Expert Approved Answer
Step: 1 Unlock

Question Has Been Solved by an Expert!
Get step-by-step solutions from verified subject matter experts
Step: 2 Unlock
Step: 3 Unlock