

Question: A scatterplot is used to display data where x is the amount of time, in minutes, one member can tolera sauna, and y is the
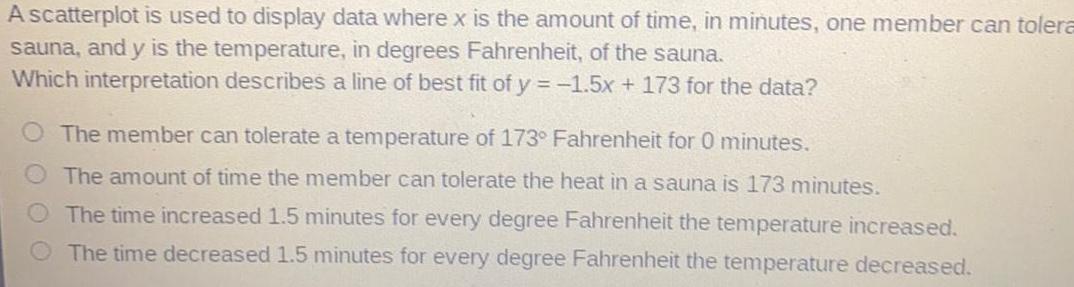

A scatterplot is used to display data where x is the amount of time, in minutes, one member can tolera sauna, and y is the temperature, in degrees Fahrenheit, of the sauna.Which interpretation describes a line of best fit of y=-1.5x + 173 for the data?The member can tolerate a temperature of 173° Fahrenheit for 0 minutes.The amount of time the member can tolerate the heat in a sauna is 173 minutes.The time increased 1.5 minutes for every degree Fahrenheit the temperature increased.The time decreased 1.5 minutes for every degree Fahrenheit the temperature decreased.
Step by Step Solution
There are 3 Steps involved in it
1 Expert Approved Answer
Step: 1 Unlock

Question Has Been Solved by an Expert!
Get step-by-step solutions from verified subject matter experts
Step: 2 Unlock
Step: 3 Unlock