

Question: A schematic representation of a vibration test rig is shown in Figure Q2.1, where m is a mass positioned between two springs of stiffness
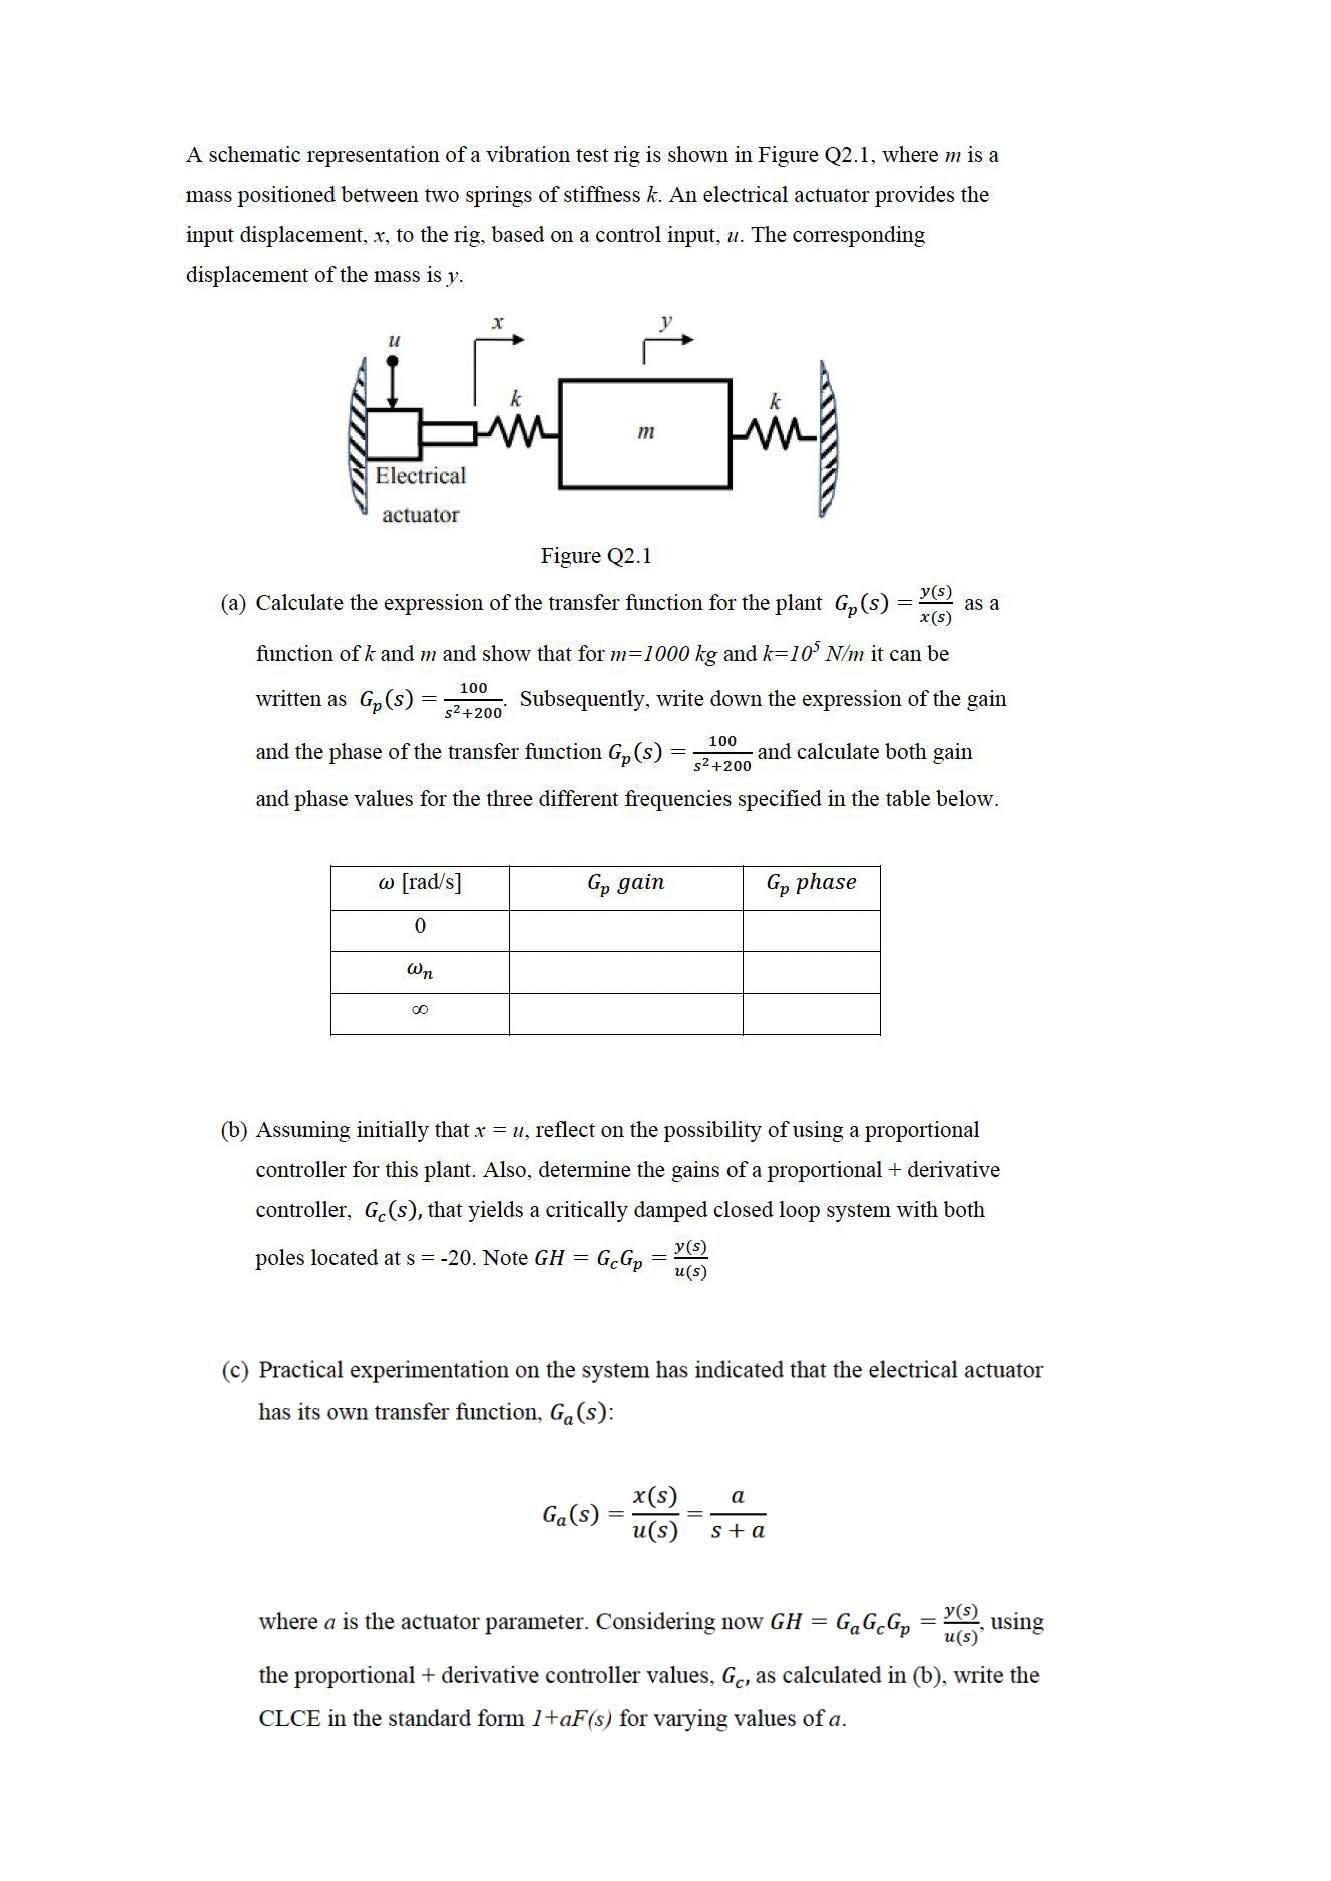
A schematic representation of a vibration test rig is shown in Figure Q2.1, where m is a mass positioned between two springs of stiffness k. An electrical actuator provides the input displacement, x, to the rig. based on a control input, u. The corresponding displacement of the mass is y. U Electrical actuator w [rad/s] 0 Wn im M Figure Q2.1 (a) Calculate the expression of the transfer function for the plant G(s) y(s) x (s) function of k and m and show that for m=1000 kg and k=10 N/m it can be written as Gp (s) Subsequently, write down the expression of the gain 100 s+200 and the phase of the transfer function G (s) and calculate both gain and phase values for the three different frequencies specified in the table below. 100 s +200 00 Jin Gp gain Ga(s) Gp phase (b) Assuming initially thatx = u, reflect on the possibility of using a proportional controller for this plant. Also, determine the gains of a proportional + derivative controller, Ge(s), that yields a critically damped closed loop system with both y(s) poles located at s = -20. Note GH = Gc Gp u(s) - (c) Practical experimentation on the system has indicated that the electrical actuator has its own transfer function, G (s): x(s) a u(s) s+a where a is the actuator parameter. Considering now GH = as a = Ga Gc Gp y(s) using u(s) the proportional + derivative controller values, Ge, as calculated in (b), write the CLCE in the standard form 1+aF(s) for varying values of a. =
Step by Step Solution
3.44 Rating (157 Votes )
There are 3 Steps involved in it

Get step-by-step solutions from verified subject matter experts