

Question: a. Select the graph that correctly shows the yield curve associated with the data shown in the table. b. Describe the resulting yield curve in
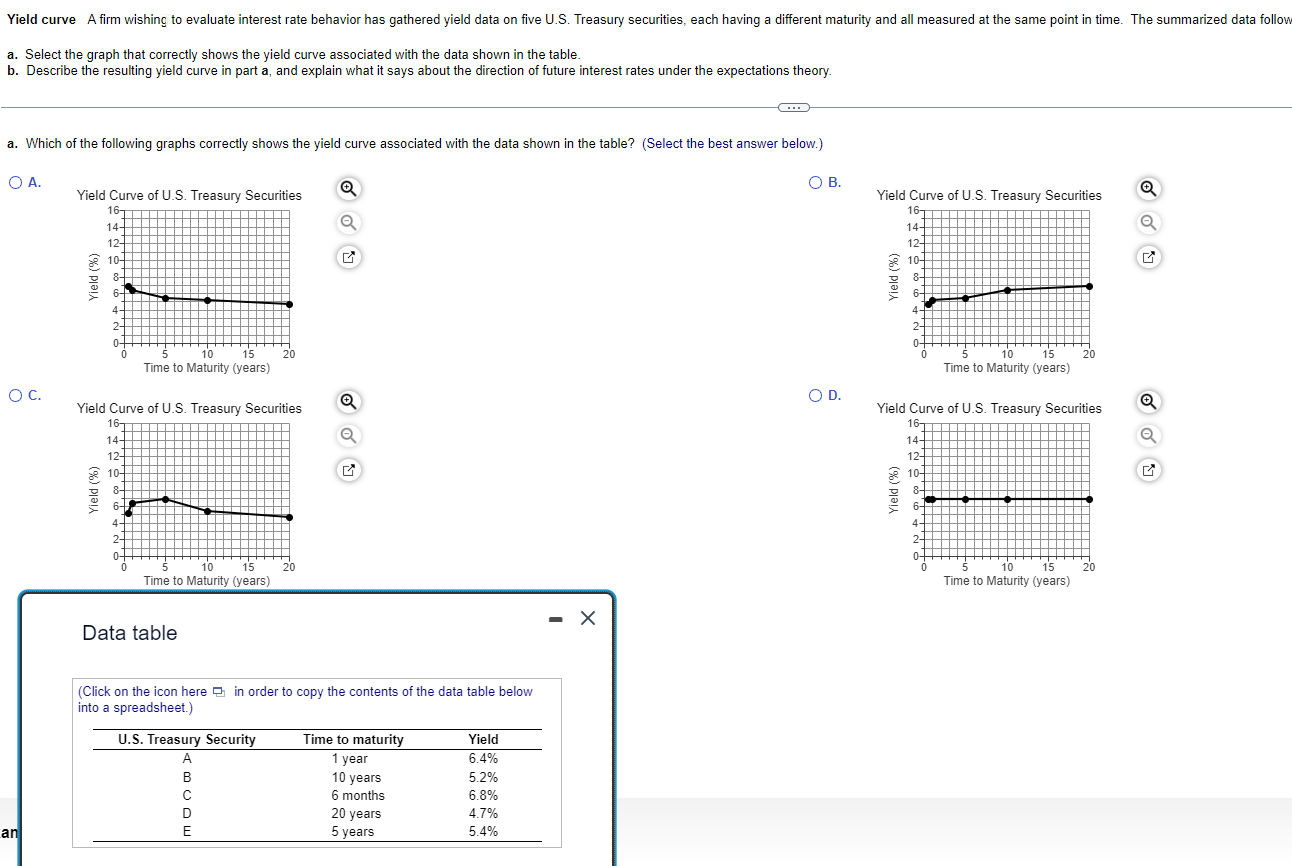
a. Select the graph that correctly shows the yield curve associated with the data shown in the table. b. Describe the resulting yield curve in part a, and explain what it says about the direction of future interest rates under the expectations theory. a. Which of the following graphs correctly shows the yield curve associated with the data shown in the table? (Select the best answer below.) A. B. C. D. Data table (Click on the icon here in order to copy the contents of the data table below into a spreadsheet.)
Step by Step Solution
There are 3 Steps involved in it
1 Expert Approved Answer
Step: 1 Unlock

Question Has Been Solved by an Expert!
Get step-by-step solutions from verified subject matter experts
Step: 2 Unlock
Step: 3 Unlock